Telemetry reference
kenny's picture of a PC's health is built from telemetry: the agent runs a set of
collectors, packs their results into a JSON snapshot, and pushes it to the server. This
page is the reference for what each section reports, how it is judged, and how long it is
kept. For day-to-day dashboard use see user-guide.md; for the exact
wire shape see protocol.md.
How telemetry flows
- The agent runs its collectors and pushes one JSON snapshot to the server — by
default every 15 minutes (
KENNY_TELEMETRY_INTERVAL_SECS, default900), plus an immediate first push right after it connects, so a freshly onboarded PC appears with real data at once. The on-demandtelemetry_collecttool forces a "refresh now". - The server persists every snapshot in SQLite — the latest plus roughly 30 days of per-agent history for the health trend and heatmaps.
- The server evaluates health rules server-side (
health_rules.py). These rules are authoritative for fleet aggregation: thresholds can change without redeploying agents. - Each section also carries an agent-set status. The final status of a section is the worst-of (agent-reported status, server-rule status). An agent's overall health is the worst-of all its sections.
See ADR-0007 for the push-model and storage decision.
Status model
Every section, every agent, and the fleet header use the same four-state model:
| Symbol | Status | Meaning |
|---|---|---|
| Green circle | ok |
nothing flagged |
| Amber ringed circle | warn |
needs attention (e.g. disk > 80 %, aging battery) |
| Red square | crit |
acute problem (e.g. Defender real-time protection off, disk ≥ 95 %) |
| Dashed grey | unknown / offline |
no recent telemetry / agent not connected |
Statuses roll up by worst-of. Within a PC, the overall status is the worst section
status; the agent-reported and server-rule status for a section are themselves combined
worst-of. Across the fleet, the header shows the worst status of any agent. crit beats
warn beats ok; an offline agent contributes unknown rather than a false ok.
Telemetry sections
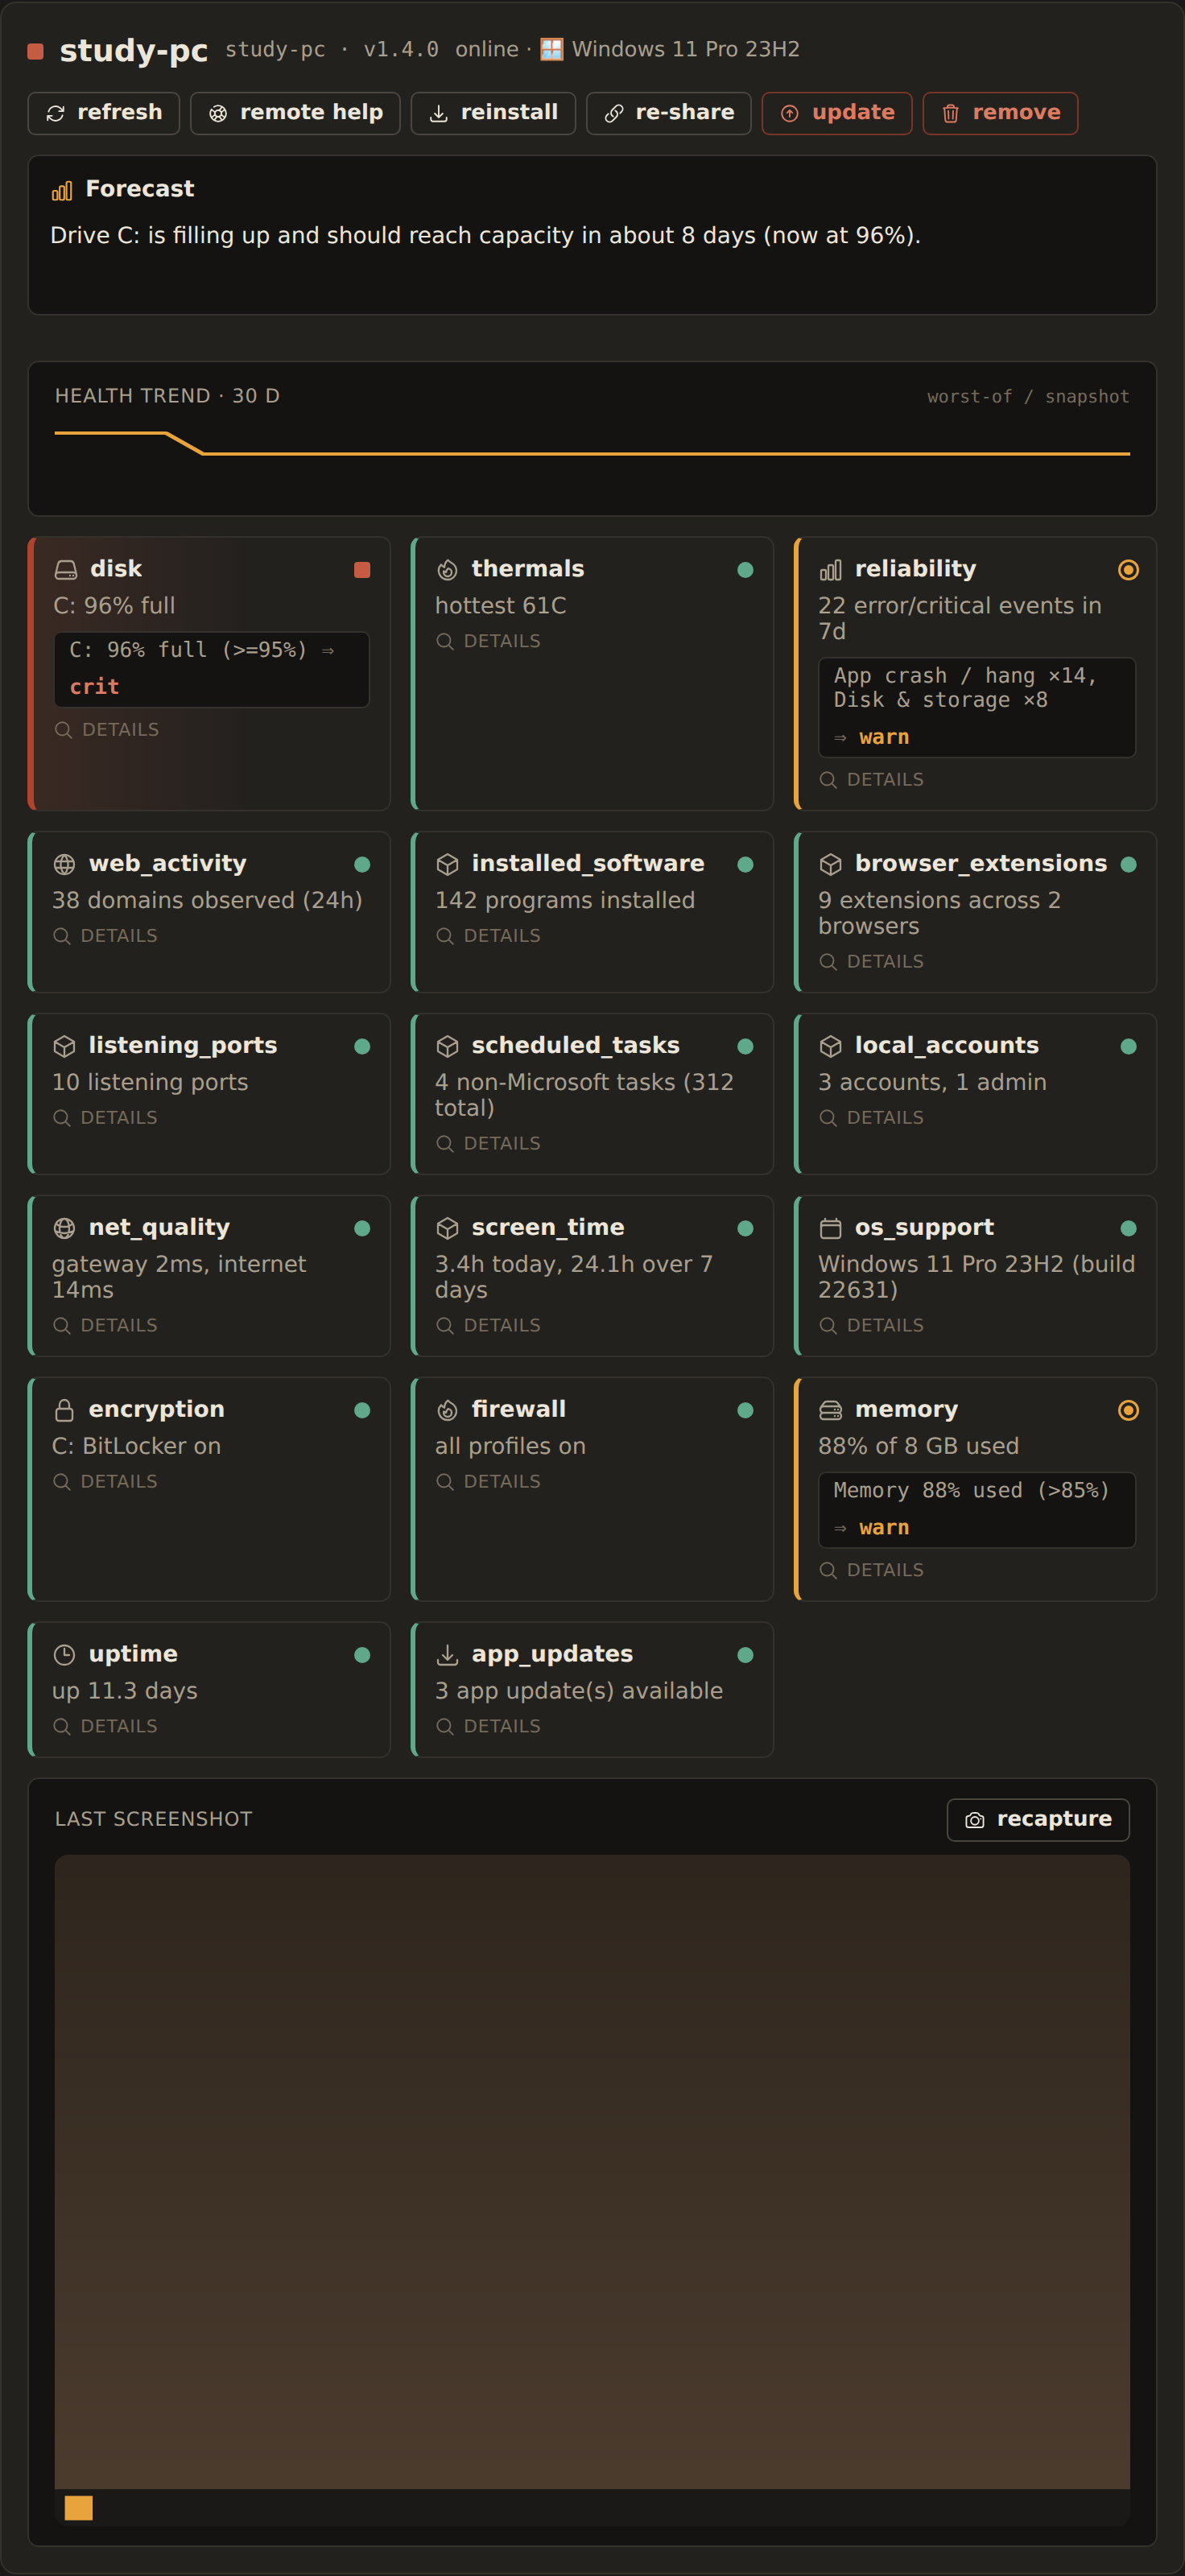
The table below lists every section, what it reports, and its server-side health rule (if any). Sections without a dedicated rule defer to the agent-reported status or are purely informational; several of them still feed the Overview dashboard (noted in the rule column).
| Section | Reports | Server-side health rule |
|---|---|---|
disk |
Volumes, free space, largest directories | worst volume percent_used ≥ 95 → crit; > 80 → warn; else ok |
disk_smart |
SMART attributes / drive health flags | no rule — agent-reported |
defender |
Microsoft Defender state, last scan | enabled false or realtime_protection false → crit; last scan older than 14 days → warn |
defender_quarantine |
Quarantined-threat inventory | no rule — agent-reported |
av_thirdparty |
Registered third-party antivirus products | no rule — agent-reported |
firewall |
Windows Firewall profile state | no rule — feeds the security-posture chart |
encryption |
BitLocker / volume encryption state | no rule — feeds the security-posture chart |
win_update |
Recent Windows Update results | any recent[].result == "failed" → warn |
app_updates |
Available third-party app updates | no rule — agent-reported |
reboot_pending |
Pending-reboot flag and reasons | pending true → warn (reasons joined into the reason string) |
os_support |
OS edition/end-of-life date, plus arch (x86_64/aarch64, mirrors register.meta.arch, protocol 0.13) |
eol true or eol_date in the past → crit; eol_date within 90 days → warn |
memory |
RAM usage | percent_used > 95 → crit; > 85 → warn |
thermals |
Temperature sensors | hottest sensor ≥ 95 °C → crit; ≥ 85 °C → warn |
battery |
Battery health and charge (laptops) | health_percent < 50 → crit; < 70 → warn. Laptops only; battery.present drives the device (laptop/desktop) pie |
reliability |
Grouped Error/Critical event-log breakdown, stability index | recent_crashes ≥ 50 or stability_index < 3 → crit; ≥ 15 events, any critical-level group, or stability_index < 6 → warn. Reason names the top-3 problem categories |
web_activity |
Observed domains (parental controls) | a serious flagged hit (custom / seed / external_adult) in 24 h → crit; a bypass hit in 24 h → warn (see parental-controls.md) |
listening_ports |
Listening TCP/UDP ports | a non-loopback listener on 22 / 3389 / 5900 / 5985 / 5986 → warn |
local_accounts |
Local users and administrators | an enabled admin with password_required false and no password ever set → crit; built-in Administrator or Guest enabled → warn |
backup_status |
Restore points, File History, OneDrive | no restore point in 30 days and File History not running and OneDrive not running → warn |
net_quality |
Gateway + reference ping probe | reference loss ≥ 60 % → crit; gateway latency > 100 ms or loss > 20 % → warn |
installed_software |
Installed programs inventory | no rule — agent-reported |
browser_extensions |
Browser extensions across profiles | no rule — agent-reported |
scheduled_tasks |
Non-Microsoft scheduled tasks | no rule — agent-reported |
services |
Windows service inventory | no rule — agent-reported |
autostart |
Autostart / run-key entries | no rule — agent-reported |
peripherals |
Connected devices | no rule — agent-reported |
printers |
Installed printers | no rule — agent-reported |
network |
Adapters and IP configuration | no rule — agent-reported |
routing |
Routing table | no rule — agent-reported |
wifi_quality |
Wi-Fi signal / link quality | no rule — agent-reported |
time_sync |
Clock synchronization state | no rule — agent-reported |
uptime |
Boot time and uptime | no rule — agent-reported |
processes |
Running-process summary | no rule — agent-reported |
screen_time |
Whole-machine interactive minutes per day | no rule — informational (see below) |
What feeds the Overview dashboard
A few informational sections drive the fleet-wide Overview panels rather than a per-section status:
firewall+encryption+defender→ the security-posture chartbattery.present→ the laptop / desktop device pieos_support→ the OS piereliabilityevents → the reliability heatmap
Reliability categorization
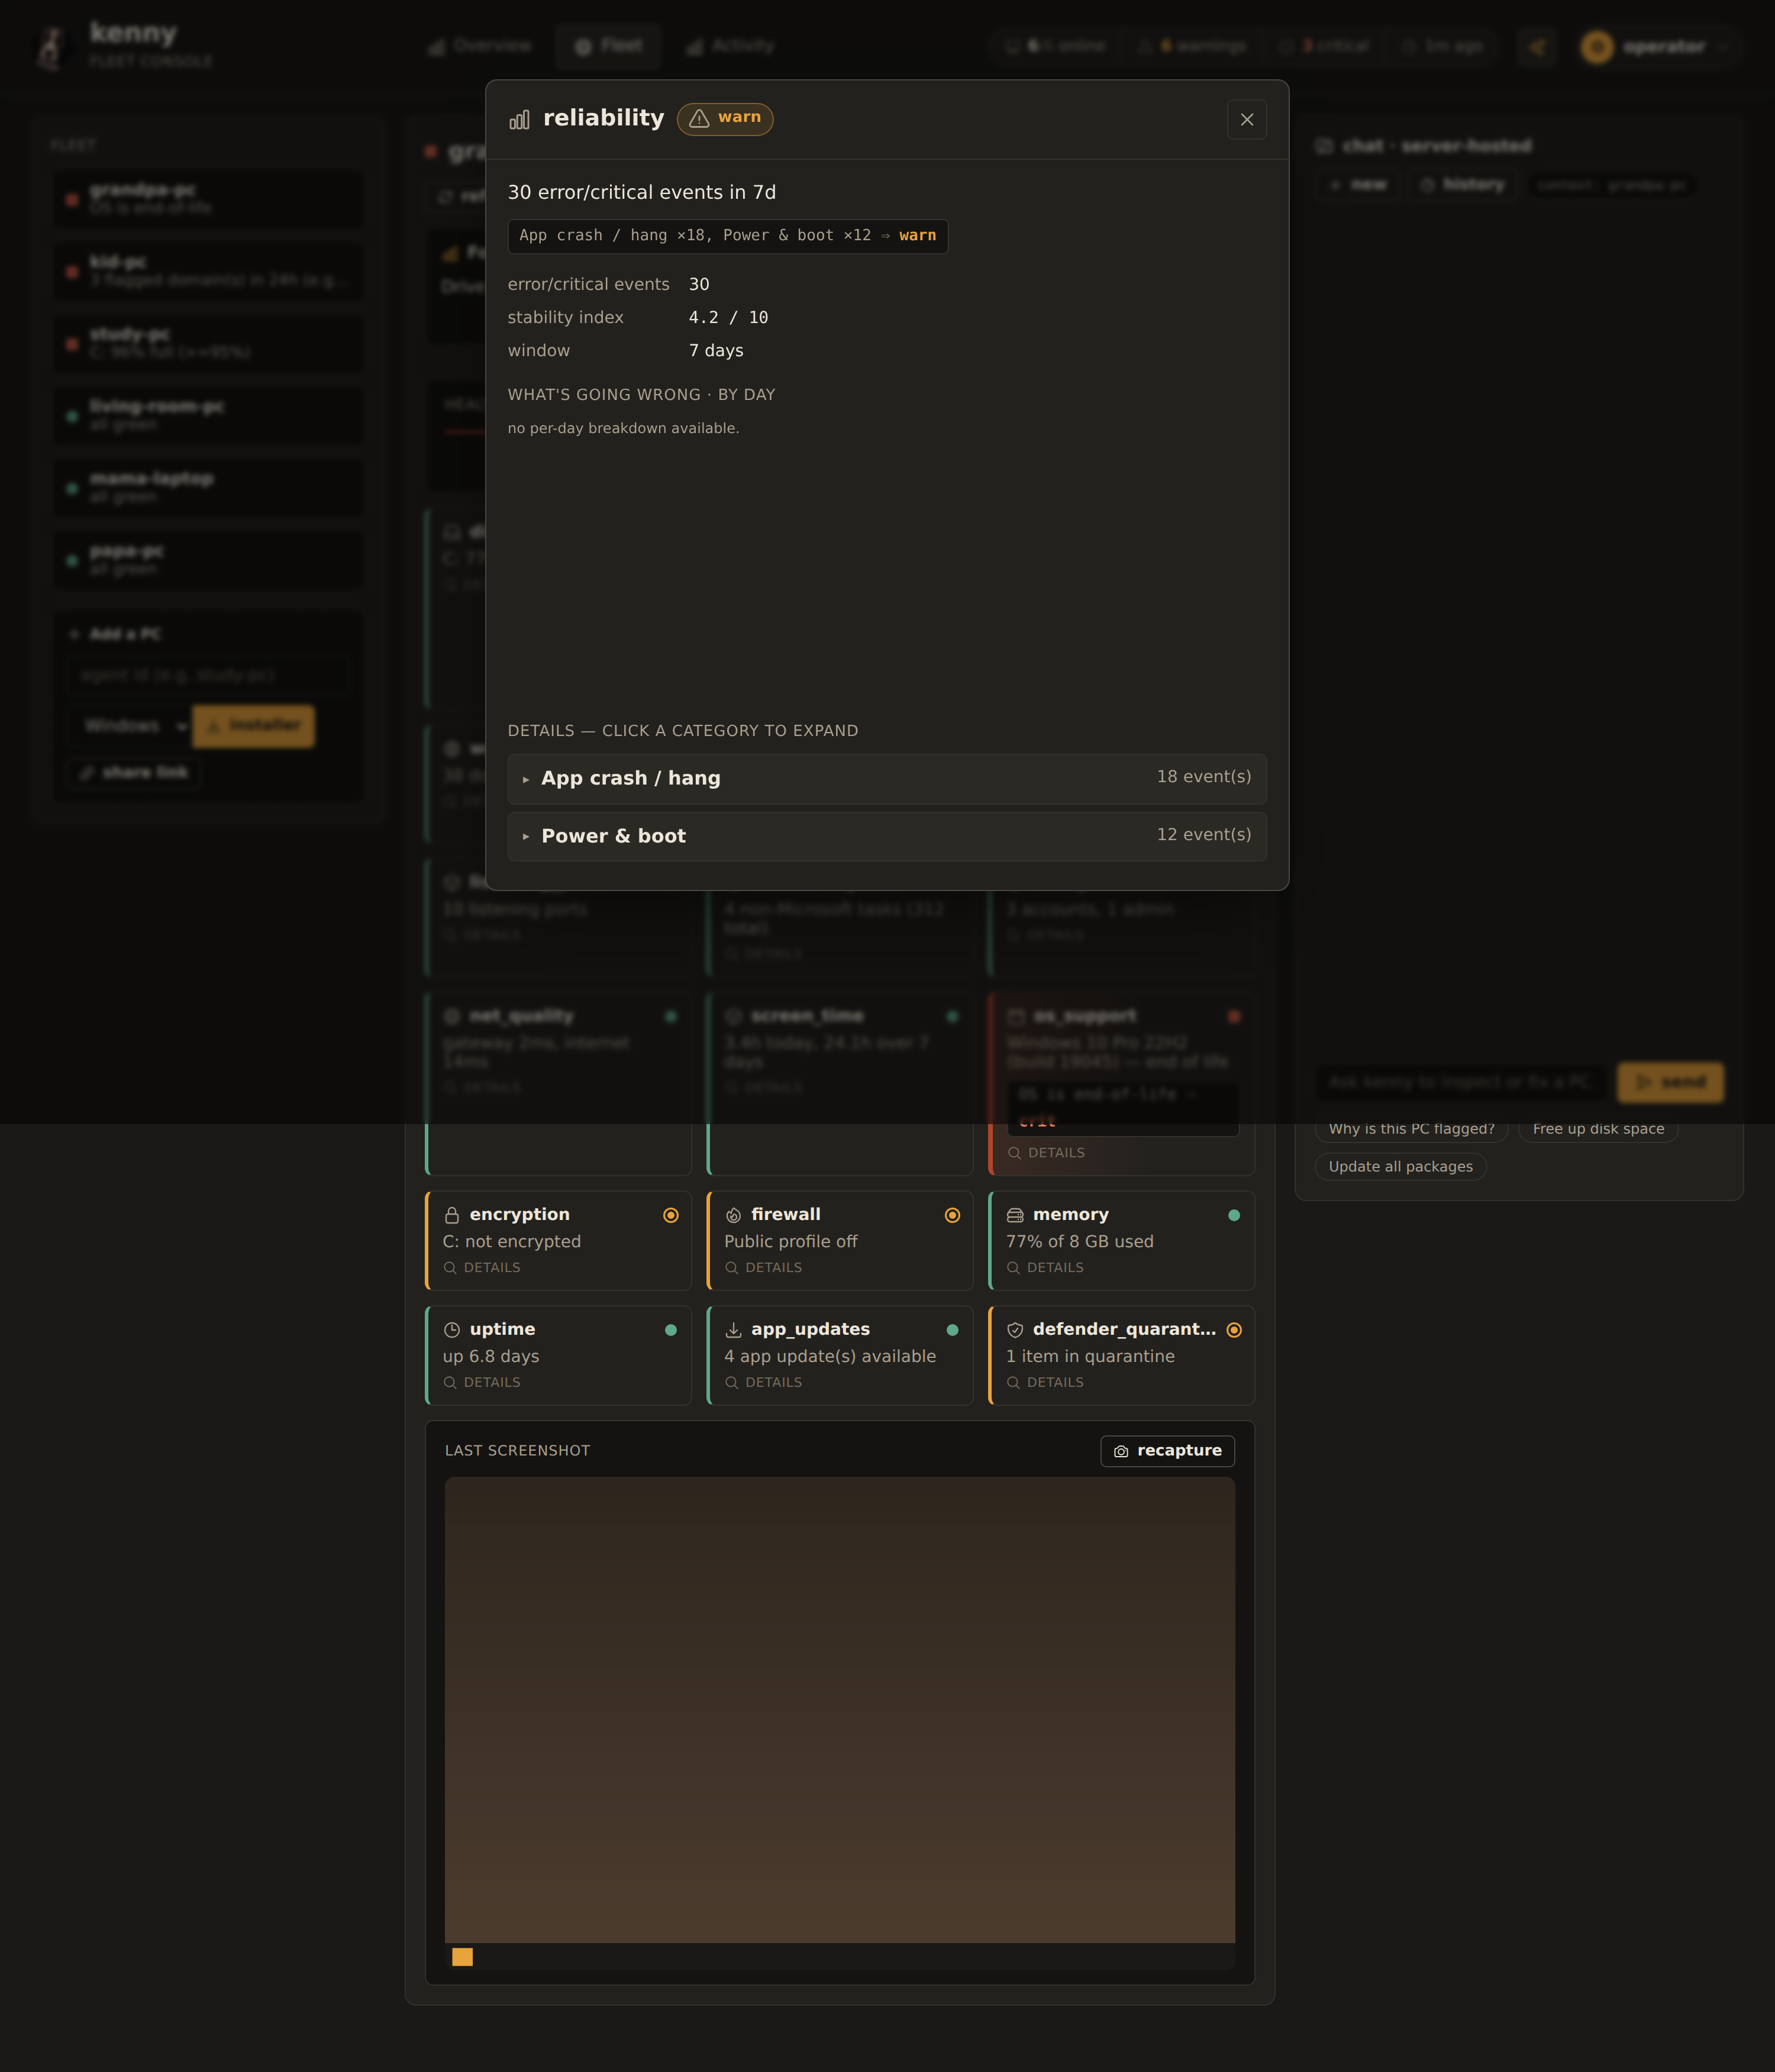
The reliability section reports a breakdown of Error/Critical Windows event-log
entries — grouped by source + event_id, each with a sample message and per-day counts
— rather than a single number. To make those groups legible, the server sorts each
distinct group into one friendly category:
Disk & storage · App crash / hang · Bluescreen / bugcheck · Driver & hardware · Power & boot · Windows service · Windows Update · Network · Security · Other.
The mapping is done by the connected LLM (Haiku) on the telemetry read path,
validated against that fixed enum, and cached by (source, event_id) — so after
warm-up it is effectively a no-op. The category is a server-side annotation; the agent
never sends it. Without an ANTHROPIC_API_KEY (or on an API error) every group degrades
gracefully to Other, and the heatmaps and expandable raw groups still work.
This categorization drives the reliability heatmaps: hosts × category across the fleet, and category × day for one PC.
See ADR-0028 for the categorization decision.
Screen time
The screen_time section reports whole-machine interactive minutes per calendar day
over a 7-day window — for parental awareness of how much a PC was actually in use. It is
deliberately coarse: day buckets only, and nothing finer. There are no usernames, no
per-user split, no app names or titles, and no timestamps below the day bucket; the shape
of the payload cannot express them.
kenny reports, parents judge
No health rule judges screen time — a number of hours is neither warn nor crit. The
section always carries status: "ok" and surfaces as 7-day bars in the drill-down.
See ADR-0032, and the
parental-controls.md guide.
Retention & limits
- Retention: the server keeps roughly 30 days of per-agent snapshot history (latest + trend); older snapshots auto-prune.
-
Per-push caps: each snapshot is bounded so a misbehaving collector cannot flood the store:
Variable Default Meaning KENNY_MAX_TELEMETRY_BYTES262144(256 KiB)maximum encoded size of one push KENNY_MAX_TELEMETRY_SECTIONS128maximum number of sections per push
See setup.md for these and other environment variables, and
protocol.md for the on-the-wire telemetry frame and section shapes.
See also
user-guide.md— reading the fleet view and drill-downdashboard.md— the dashboard panels in detailprotocol.md— the agent ⇄ server wire contract- ADR-0007 — push model & SQLite storage
- ADR-0028 — LLM reliability categorization
- ADR-0031 — security & resilience sections
- ADR-0032 — screen-time aggregation