The dashboard, widget by widget
The kenny fleet console is a single-page web app served by the server at /. It is
deliberately dependency-light (one vendored charting library, no build step), works in dark
and light themes, and is driven by the login session you get at /login (multi-user
accounts, roles, and per-user host scope — see Accounts & roles).
This page is the exhaustive tour: every tab, widget, menu, popup, and interaction. If you just want the common workflows, start with the User guide; come back here when you want to know what a particular control does.
How to read this page
kenny has three top-level tabs — Overview, Fleet, and Activity — plus a
Flagged view you reach from the header. Each tab is a URL you can bookmark
(#/overview, #/fleet, #/activity/audit, #/activity/events, #/flagged/warn,
#/flagged/crit). The examples below use a demo fleet of six family PCs.
The shell: header & global controls

Every view shares one header:
- Brand — the kenny mark and the "fleet console" subtitle (top-left).
- Tab navigation — Overview · Fleet · Activity. The active tab is highlighted.
- Fleet-metrics pill — a compact, always-visible summary of the whole fleet:
online
x/y· warnings · critical · last push. The warnings and critical counts are section totals across the fleet (one PC can contribute several), and when either is above zero it becomes a link into the Flagged view. On narrow screens the word labels collapse to icon + number. - ✨ Copilot toggle (Fleet tab only) — show/hide the chat rail (see The copilot).
- User menu — your avatar (a selectable dog-breed image, or your initials when none is
set) and username, top-right. Clicking it opens a dropdown that collects the global
controls:
- Profile and Users (superuser only) — see Accounts & roles.
- Light mode / Dark mode — the theme toggle; switches dark ↔ light in place (the menu
stays open, and the item names the theme it switches to). The choice is saved in
localStorageand applied before first paint (no flash); charts repaint from the cached data on toggle. - Settings (superuser only) — opens the
#/settingsconfig panel. - About — opens the About box.
- Documentation — opens the project's docs site (this GitHub Pages site) in a new tab.
- Log out (
/logout).
Accounts & roles (the user menu)
kenny is multi-user (ADR-0037). On first run the console shows a one-time setup page; the first account you create becomes the superuser. After that, three roles gate what each surface shows:
- Superuser — everything, including user management and core Settings.
- Operator — the whole fleet (all hosts, all fleet operations) but not user management and not Settings.
- User — only the hosts assigned to them: they see and can operate on those hosts, but cannot remove a host from inventory, and never see Settings or fleet-wide admin controls.
Profile (all roles) lets you set your email, pick an avatar from the dog-breed grid,
change your password, enable/disable two-factor (TOTP) (scan the shown otpauth://
secret into an authenticator, then confirm a code), and mint/revoke personal access
tokens. Claude Desktop normally connects with the built-in OAuth flow
(ADR-0041) — no token needed; personal
access tokens are the Bearer credential for scripts and other MCP clients that can't do OAuth,
sent as Authorization: Bearer <pat> to /mcp and shown once at creation.
Users (superuser only) lists every account and lets you create, edit (role, email,
avatar, enable/disable), delete, reset a password, reset 2FA, assign the host scope for a
user-role account, and manage that user's access tokens.
Existing single-token installs keep working across the upgrade: the legacy
KENNY_OPERATOR_TOKEN is still accepted as a back-compat superuser while you create real
accounts.
The Overview tab
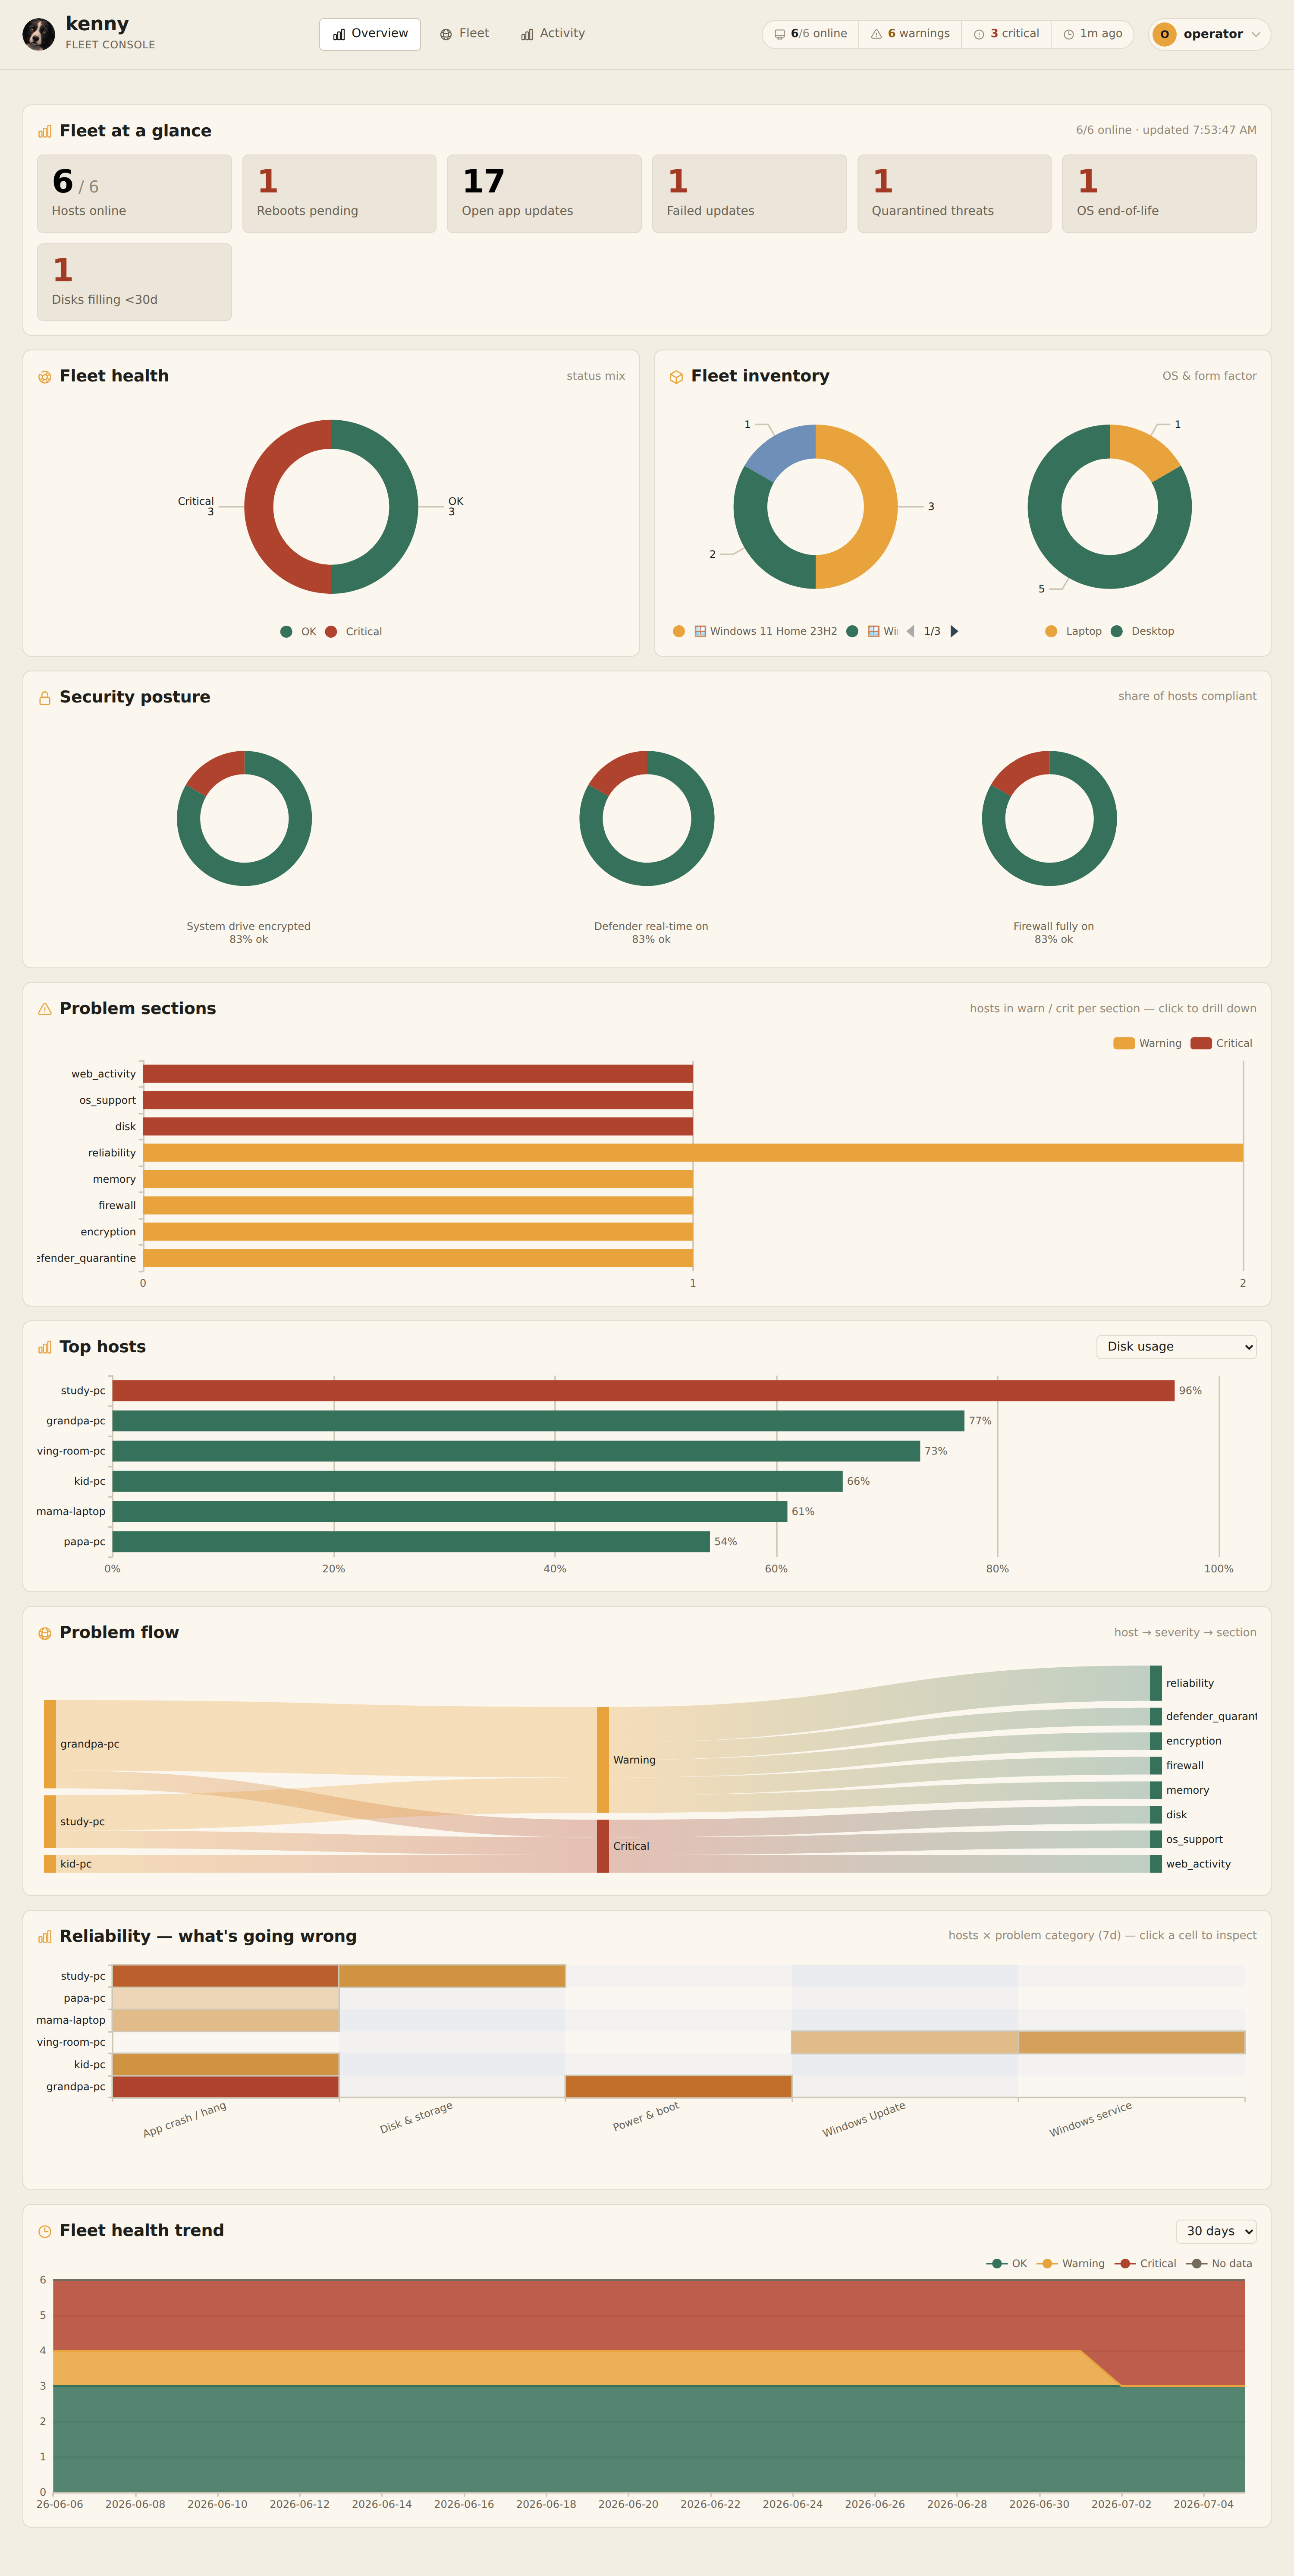
The landing view: a high-level, fully drill-down-able dashboard built from the latest snapshot of every agent. Every segment, bar, node, cell, and KPI is clickable and opens a table of the hosts behind that figure (see Drill-downs).
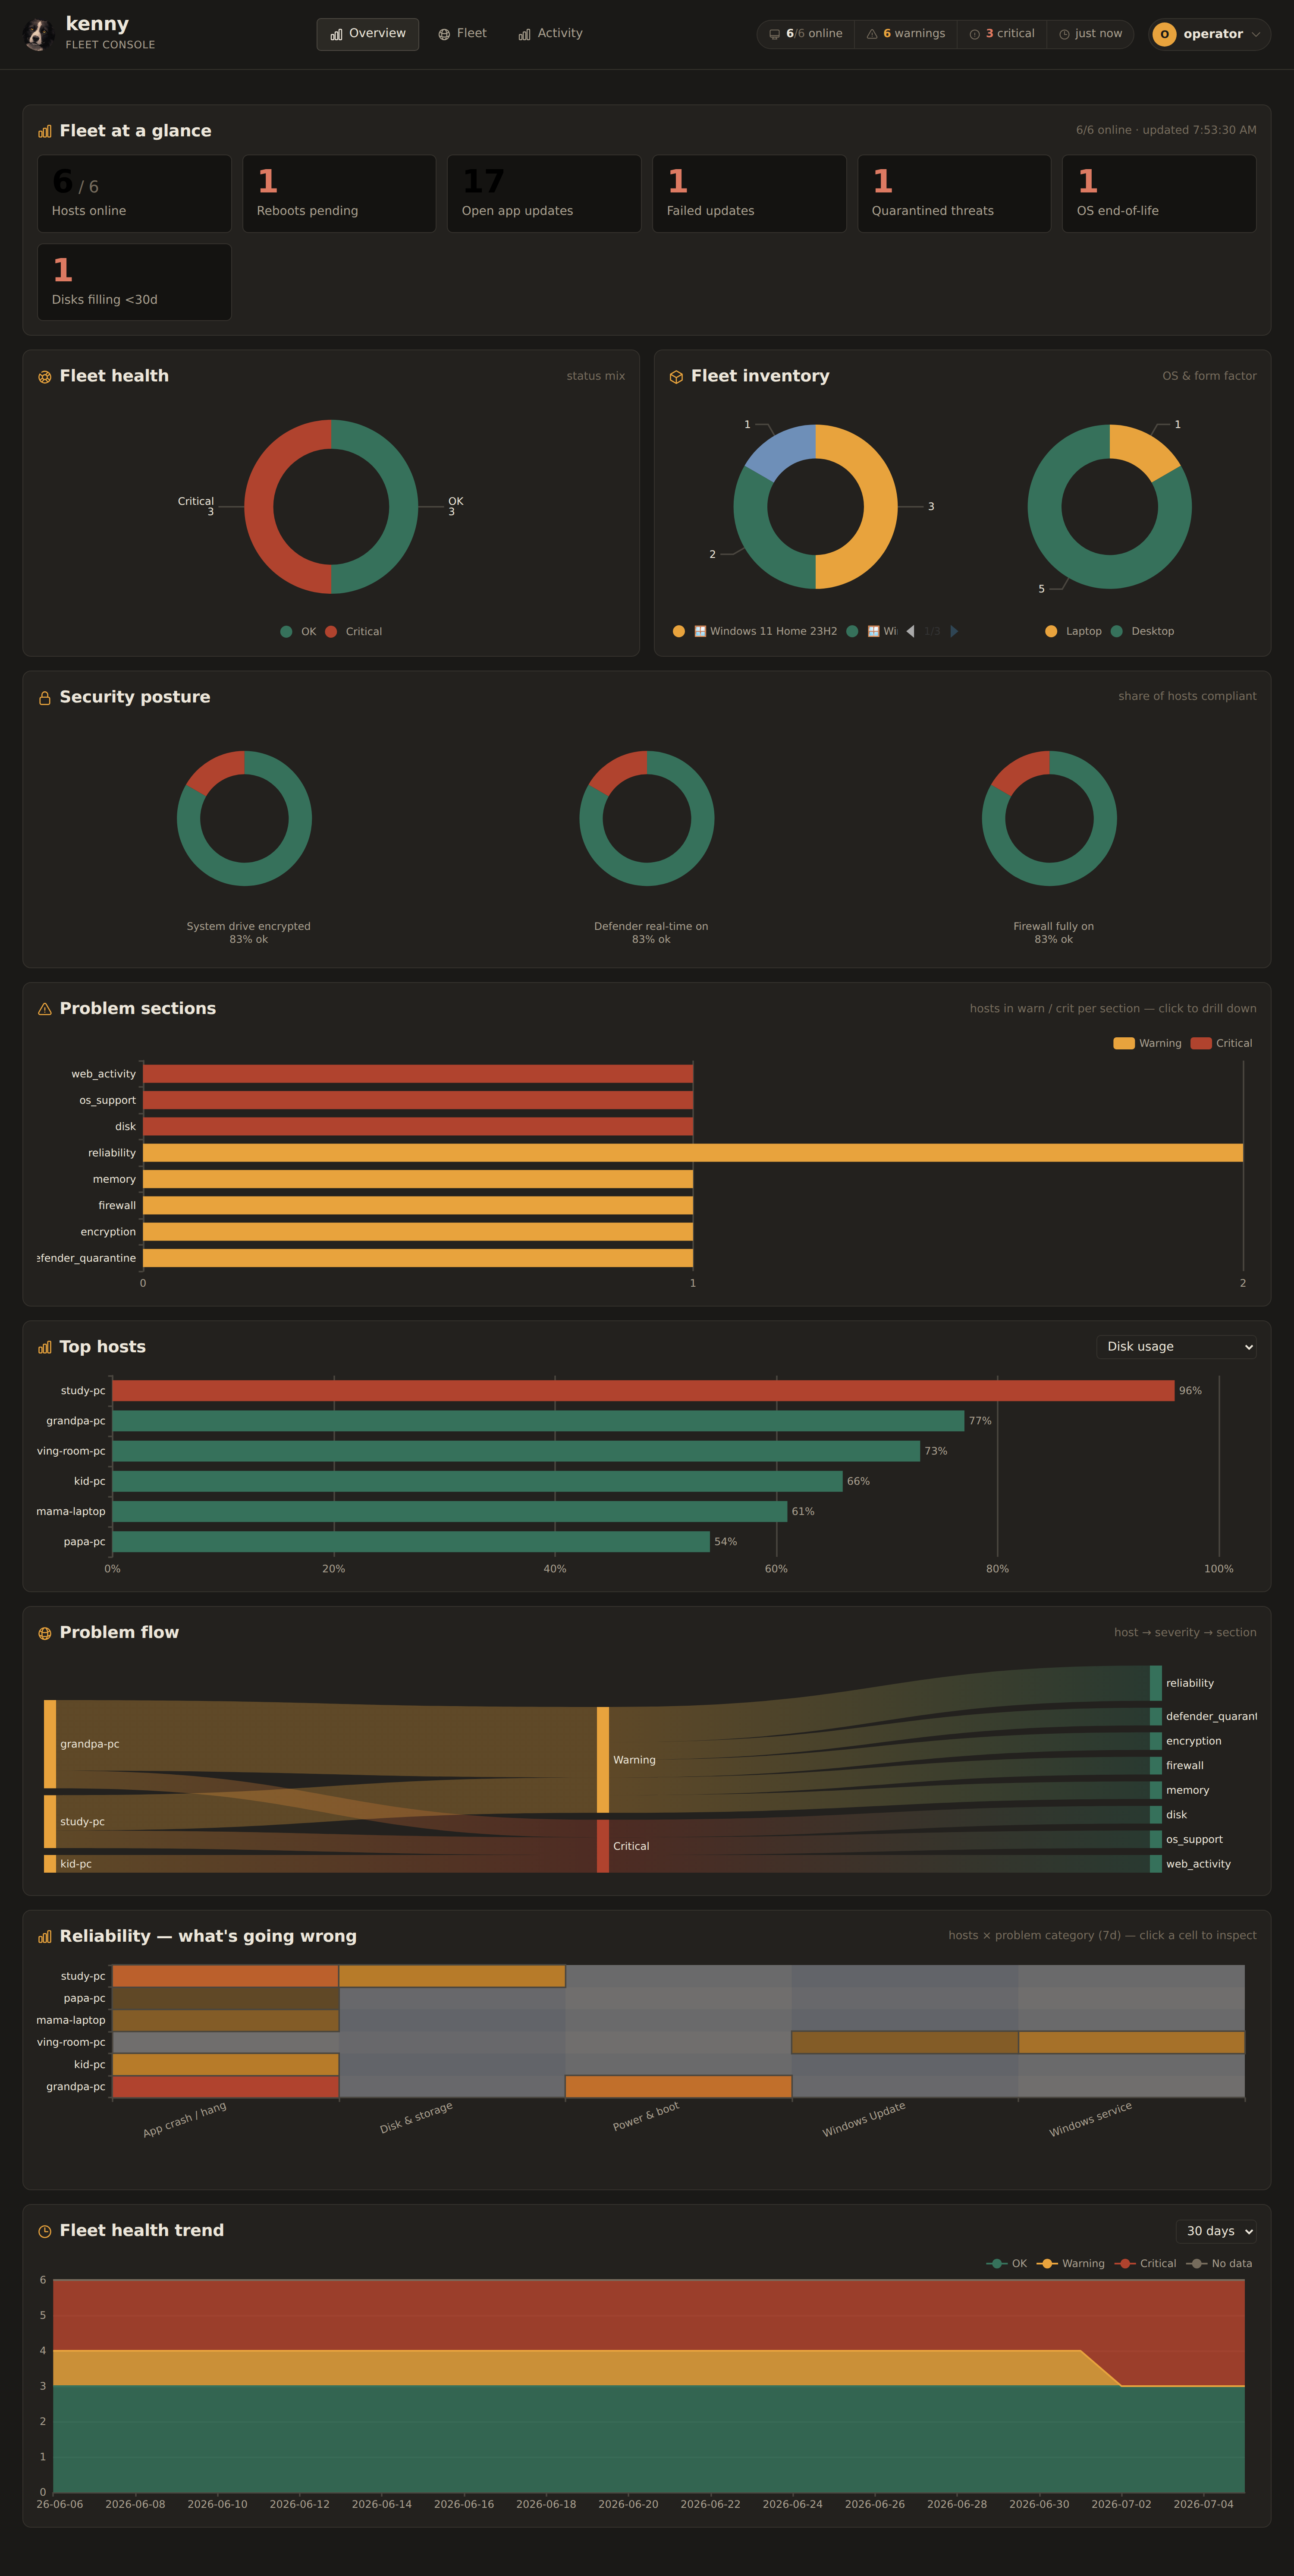
Fleet at a glance (KPI tiles)
Seven actionable totals, each a single number no chart shows on its own:
| KPI | What it counts |
|---|---|
| Hosts online | agents currently connected, out of the total known |
| Reboots pending | hosts with a pending reboot |
| Open app updates | total winget/app upgrades available across the fleet |
| Failed updates | Windows Updates that failed in the last 30 days |
| Quarantined threats | items in Defender quarantine |
| OS end-of-life | hosts on an EOL / soon-EOL Windows build |
| Disks filling <30d | volumes forecast to fill within 30 days |
Tiles with a non-zero "attention" value (reboots, failed updates, quarantine, EOL, disk forecast) render in the critical colour. Click any non-empty tile for the host list behind it.
Fleet health · Fleet inventory
- Fleet health — a donut of the fleet's rolled-up status mix (OK / Warning / Critical / No data). Click a segment to list those hosts.
- Fleet inventory — two donuts side by side: OS (which Windows versions make up the
fleet, from
os_support) and device (laptop vs desktop, inferred from whether abatterysection is present).
Security posture
Three small-multiple donuts showing the share of hosts compliant for three controls, each with a "% ok" caption:
- System drive encrypted (BitLocker on the C: volume),
- Defender real-time on,
- Firewall fully on (all profiles enabled).
Click any slice (OK / Not OK / Unknown) to list the hosts.
Problem sections
A horizontal stacked bar per telemetry section, split Warning vs Critical, showing how many hosts are flagged in each section — worst at the top. Click a bar segment to drill into those hosts. This answers "which kind of problem is most widespread right now?"
Top hosts
A ranked bar chart with a metric selector (top-right): Disk usage · Memory usage · Recent crashes (7d) · Uptime · Pending app updates. Disk and memory bars are colour-coded by threshold (green / amber / red). Click the chart title area for the full ranking as a table.
Problem flow (Sankey)
A flow diagram: host → severity (Warning/Critical) → responsible section. The width of each link is the number of flagged sections. Click a link to see the host/section pairs behind it, or a node to see everything touching that host or section. This is the fastest way to read "this PC is critical because of these two sections" at a glance.
Reliability — what's going wrong
A heatmap of hosts × friendly problem category over the last 7 days; each cell's colour is the event count. Categories come from the server-side reliability categorizer (App crash / hang, Disk & storage, Power & boot, …; see Telemetry reference). Click a cell to inspect the loudest sources behind it.
Fleet health trend
A stacked-area time series of daily fleet status counts, with a 7 / 30 / 90 days selector. Click a day/status band to list the hosts that were in that state that day.
Drill-downs
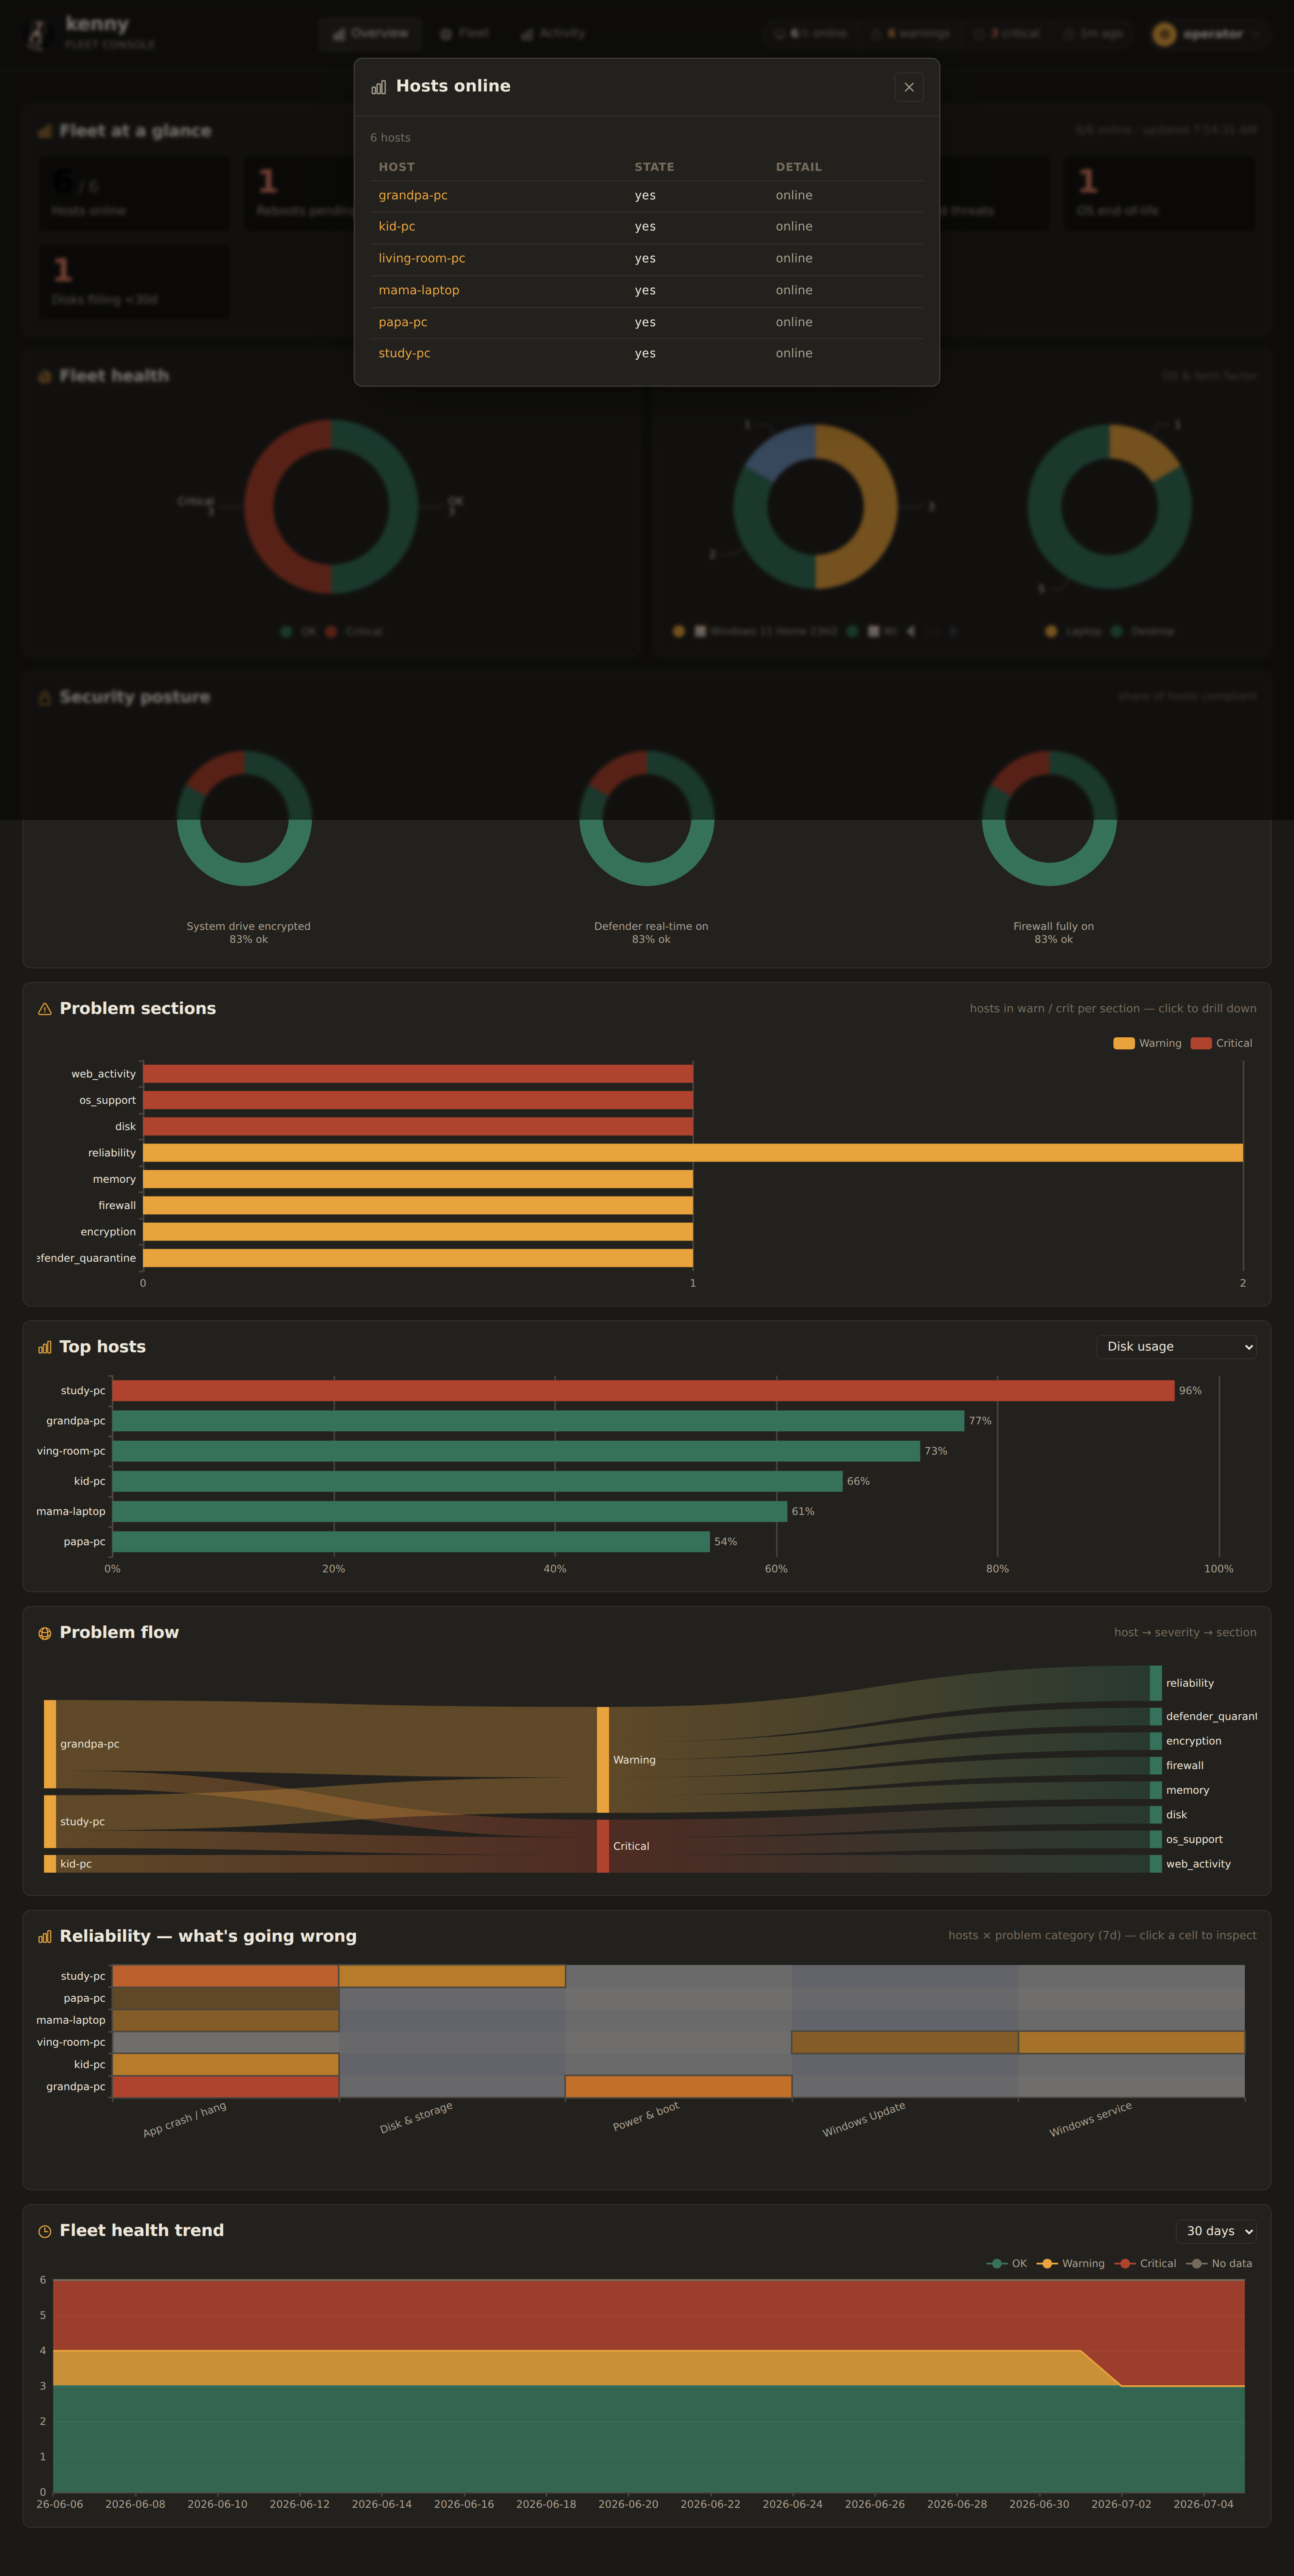
Every Overview widget shares the same drill-down popup — a table of the underlying hosts, each with the value and a one-line detail. Click a host id to jump to its agent detail on the Fleet tab.
The Fleet tab
The working view: a three-column console — the fleet list, the selected PC's agent detail, and the docked copilot chat rail.
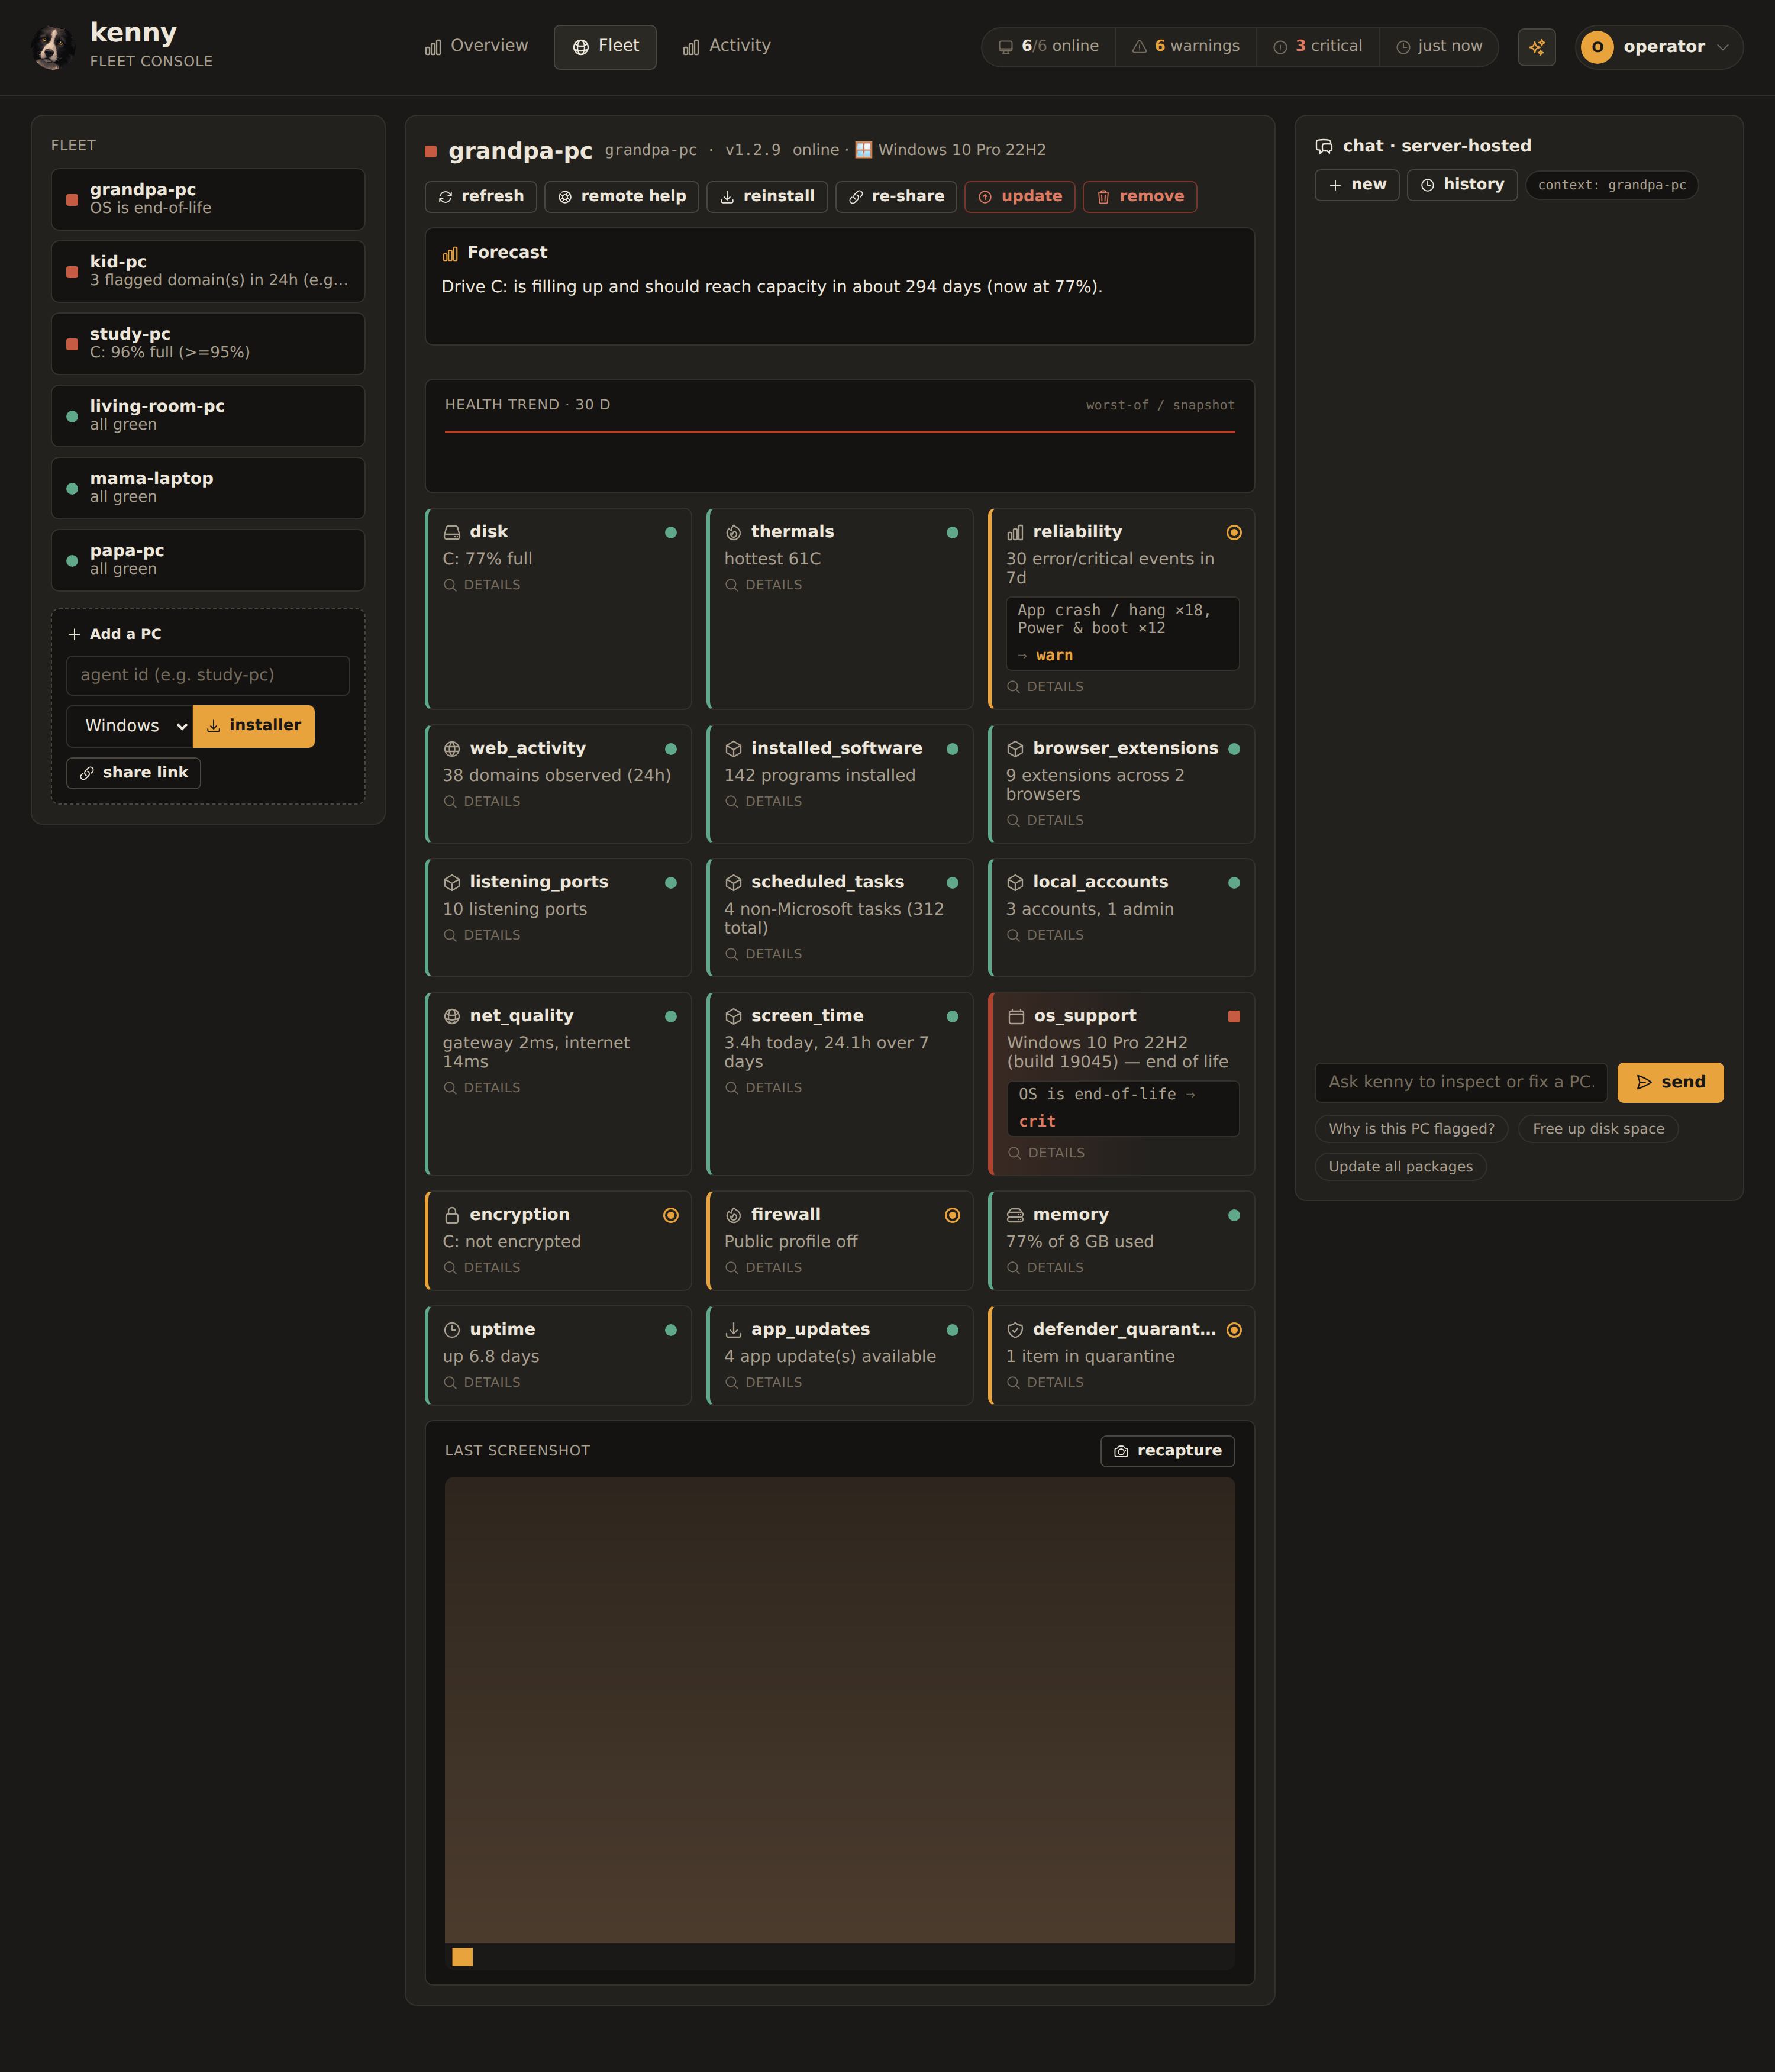
Fleet list (left)
Each PC is a tile with a status dot, its hostname, and a one-line summary (the worst section's reason). Tiles are sorted worst-first; offline PCs carry an offline badge and a critical PC is outlined in red. Click a tile to select it.
Below the list, the Add a PC panel onboards a new machine: type an agent id, pick the
target OS (Windows or Linux), then installer / share link. For Windows these are a
downloadable ZIP or a one-time, expiring link the target user can open without your login. For
Linux the panel produces a one-line install command (curl -fsSL … | sudo sh) in a
copyable modal — the Docker/K3s convenience-script model (ADR-0038). See
Adding & updating PCs.
Agent detail (centre)
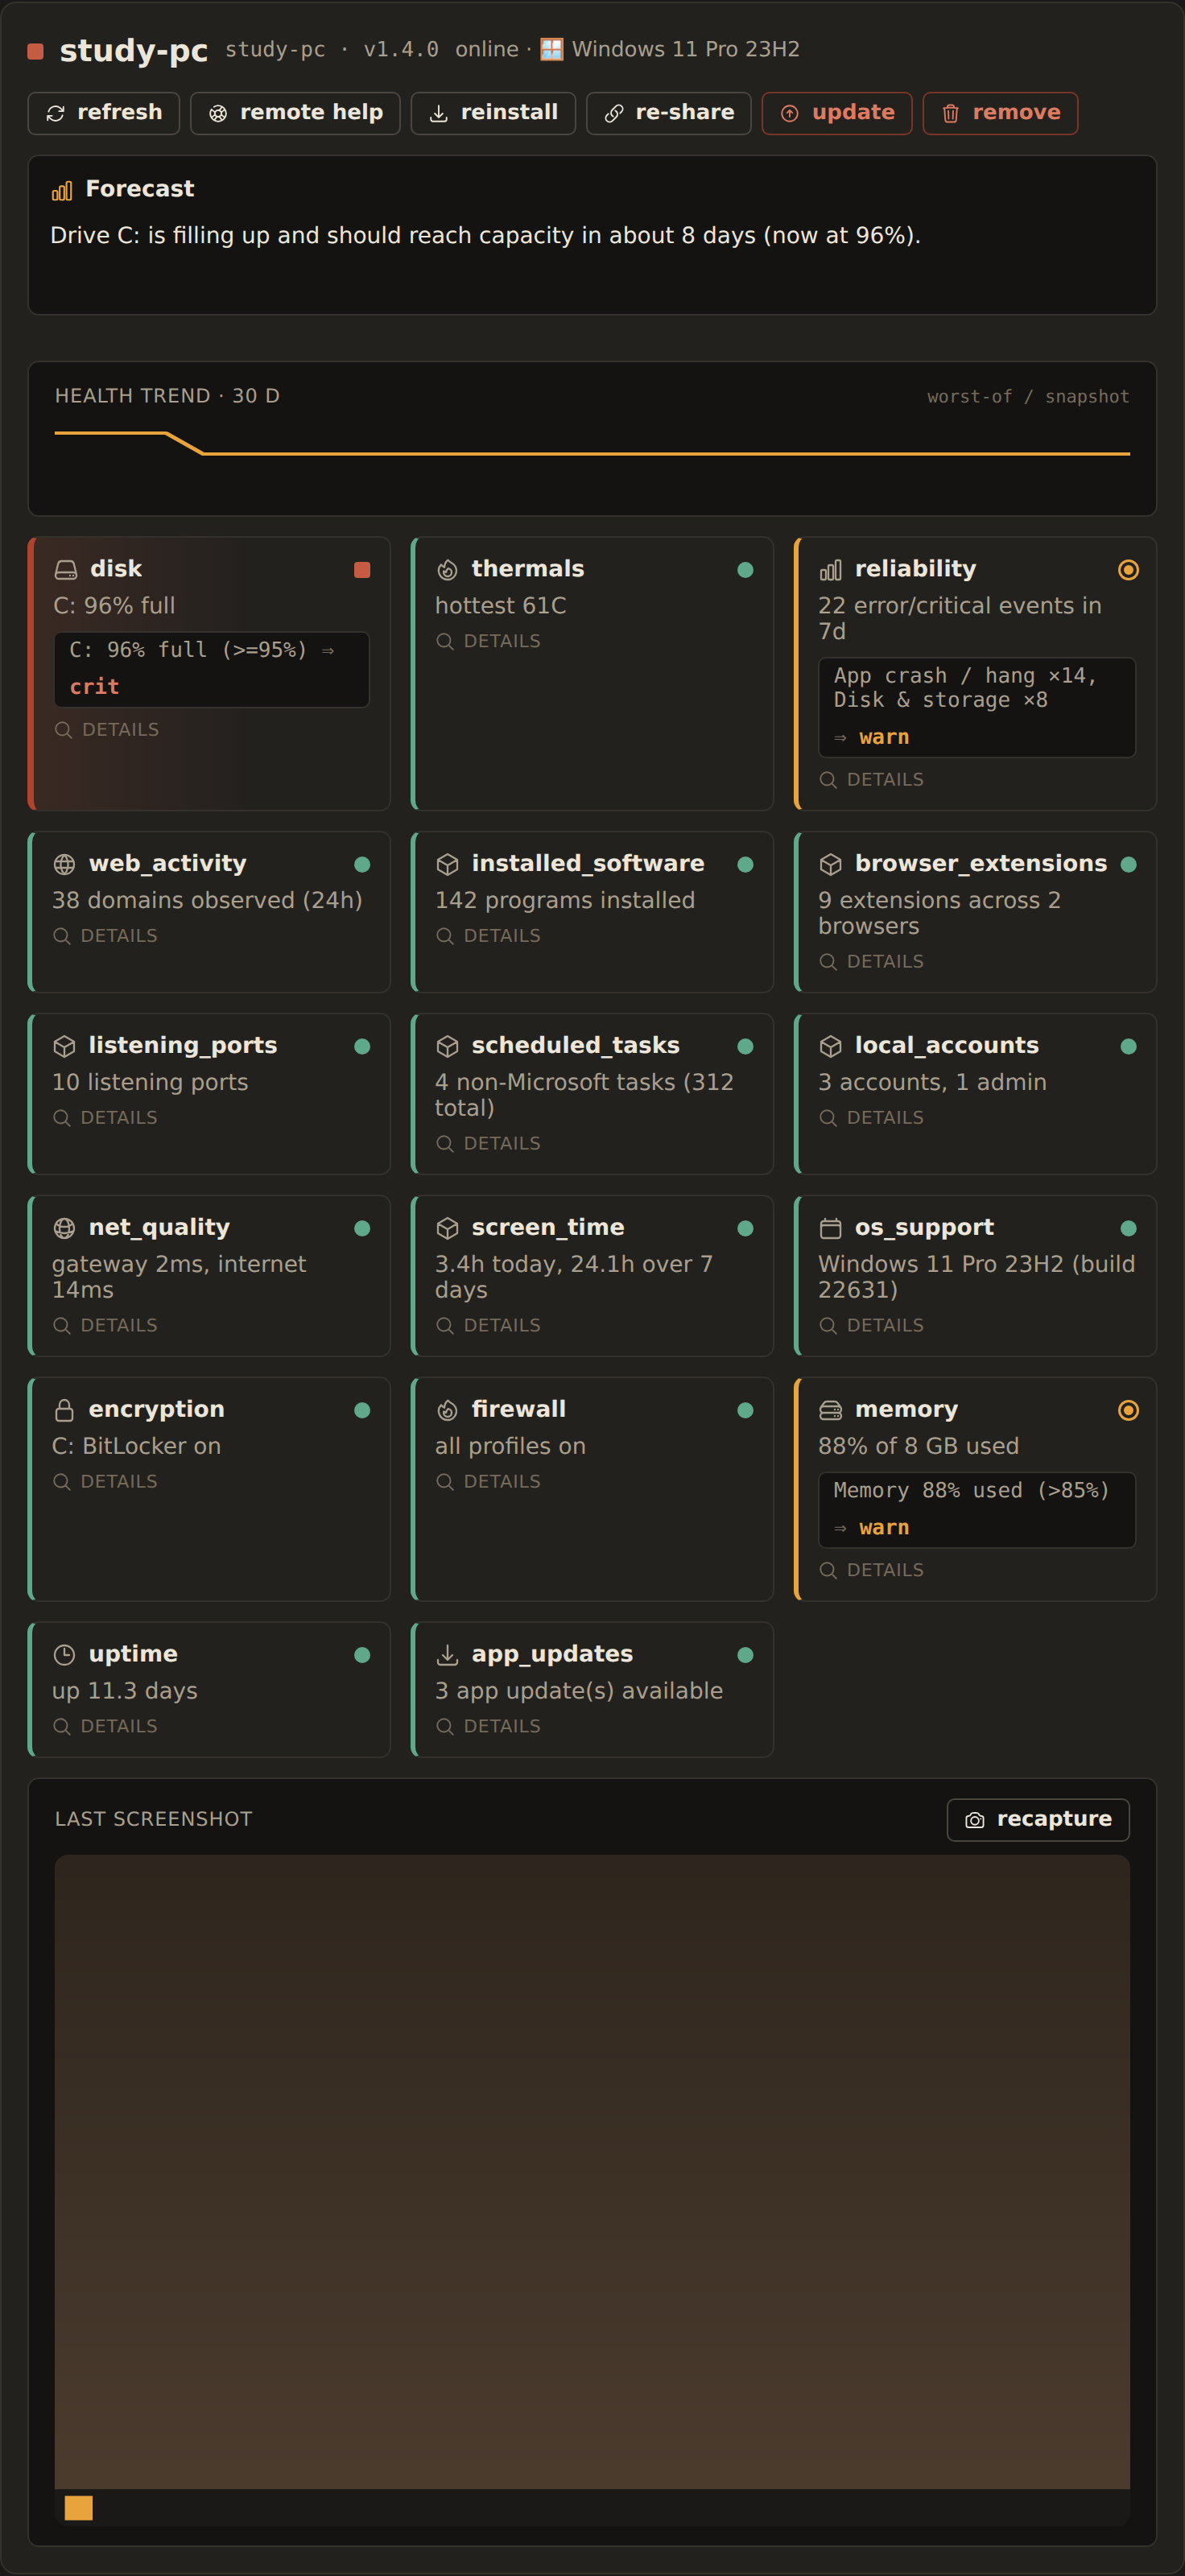
The header line shows the status dot, hostname, agent id, version, and online/OS. Then:
- Action buttons — refresh (force a fresh telemetry collect), remote help (open Quick Assist on the PC), reinstall (rebuild this PC's installer, rotating its token), re-share (a fresh one-time link for this PC), and update (push a self-update). The destructive ones confirm first.
- AI Forecast — a short, plain-English outlook pinned at the top: what is likely to need attention on this PC soon, synthesized from the disk-fill and battery trends and the inventory changes since yesterday (e.g. "Drive C: is filling up and should reach capacity in about 16 days; one new admin account appeared overnight."). With an Anthropic API key it is generated by the model and marked with a ✦; without a key the same card shows a concise deterministic summary of the same signals. See Alerting & forecasts.
- Health trend · 30 d — a sparkline of the PC's worst-of health per snapshot.
- Section tiles — one tile per telemetry section: icon, name, status dot, a one-line
summary, and — when flagged — the server's rule reason as a
reason ⇒ statuschip. Click a tile to open its section detail. Sections a collector can't report on the host OS (their summary reads n/a on this platform, e.g. the Windows-only sections on a Linux host) carry no signal and are hidden from the grid; they are still stored and remain reachable via the API. - Last screenshot — the most recent desktop capture, with a recapture button; click the image to enlarge it.
Section detail popups
Clicking a section tile opens a structured popup — never raw JSON. Scalars become a definition list, arrays of objects become tables (long tables get a filter box), and nested objects become sub-lists. The header carries the section's status pill and, when flagged, the rule-reason chip.
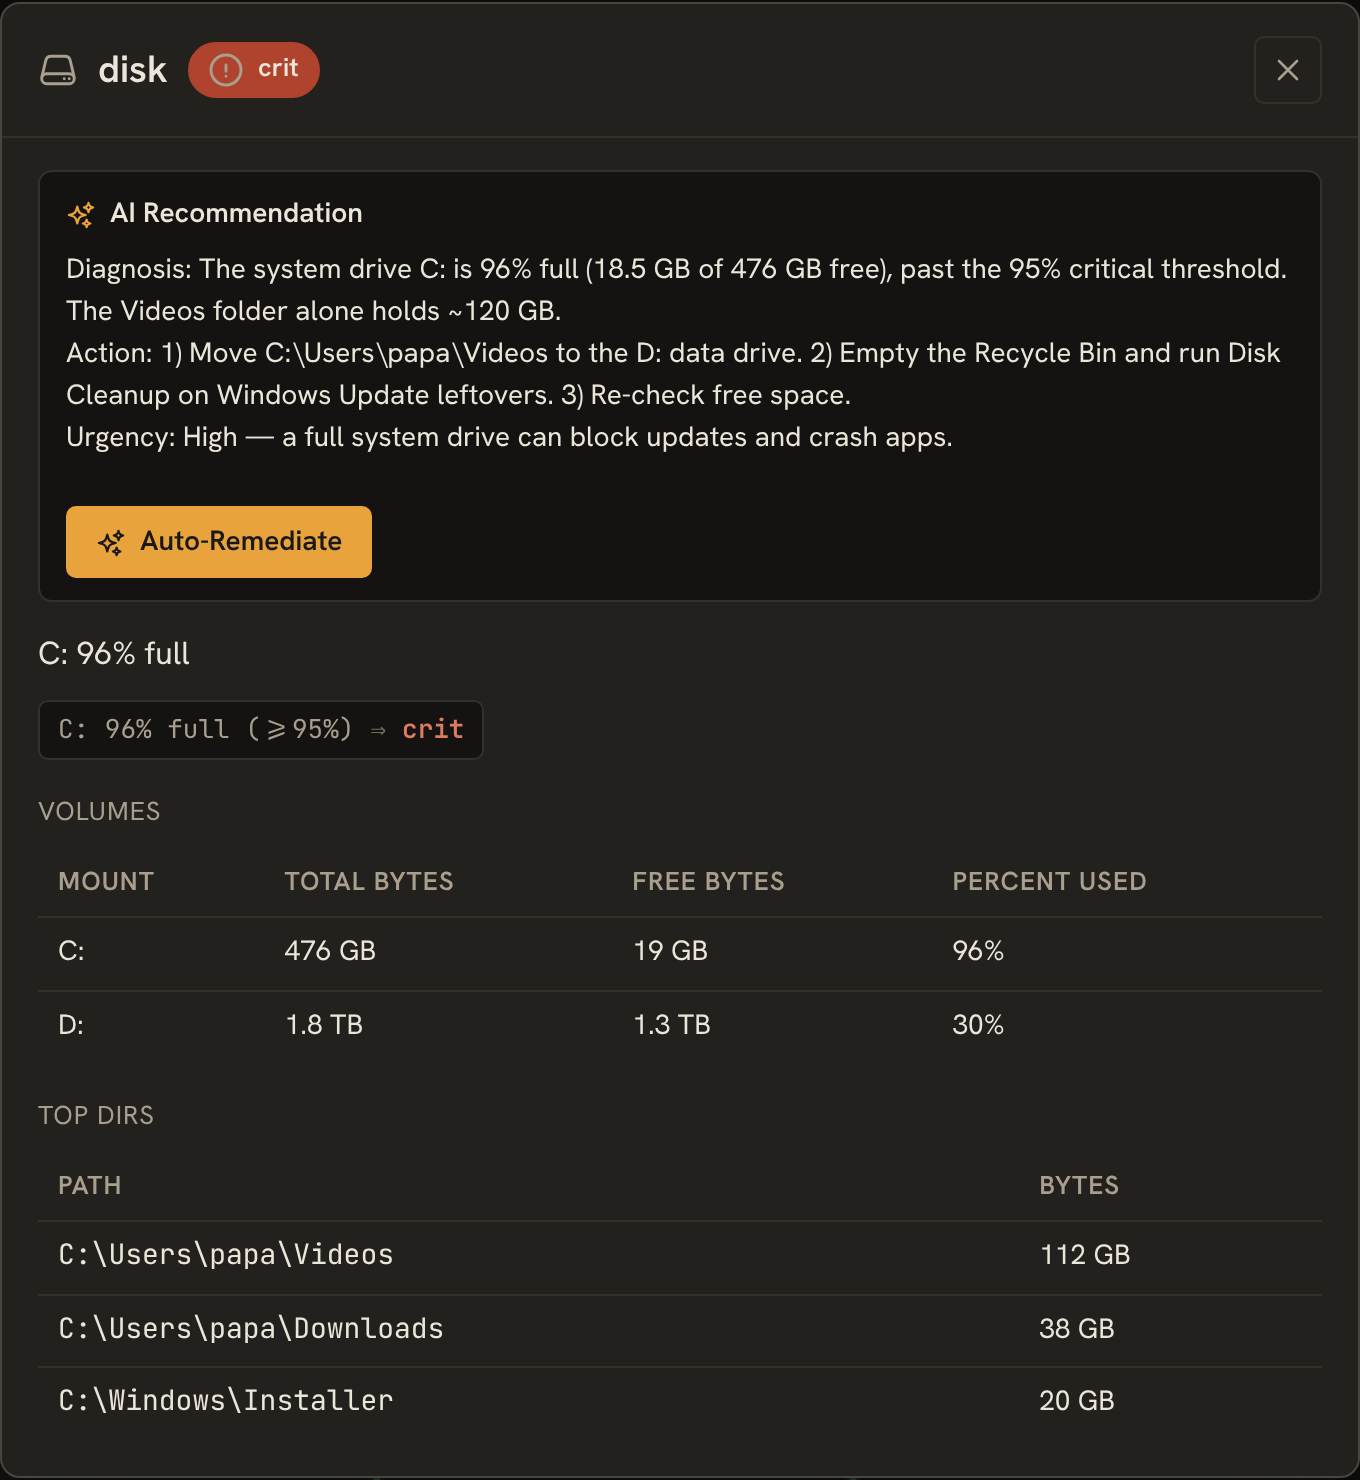
- AI Recommendation — for a flagged section, when an Anthropic API key is configured, a short Diagnosis / Action / Urgency advisory streams in at the top. If the advisor judges the issue fixable with kenny's tools it adds an Auto-Remediate button that hands a suggested prompt to the copilot (state-changing steps still hit the confirm-gate). See ADR-0019.
- Reliability has a custom renderer — a category × day heatmap plus expandable event groups:
- Web activity has the parental-controls list editor (toggles, custom domains, apply/drift); see Parental controls.
- Screen time renders whole-machine interactive minutes per day as simple bars.
The copilot (chat rail)
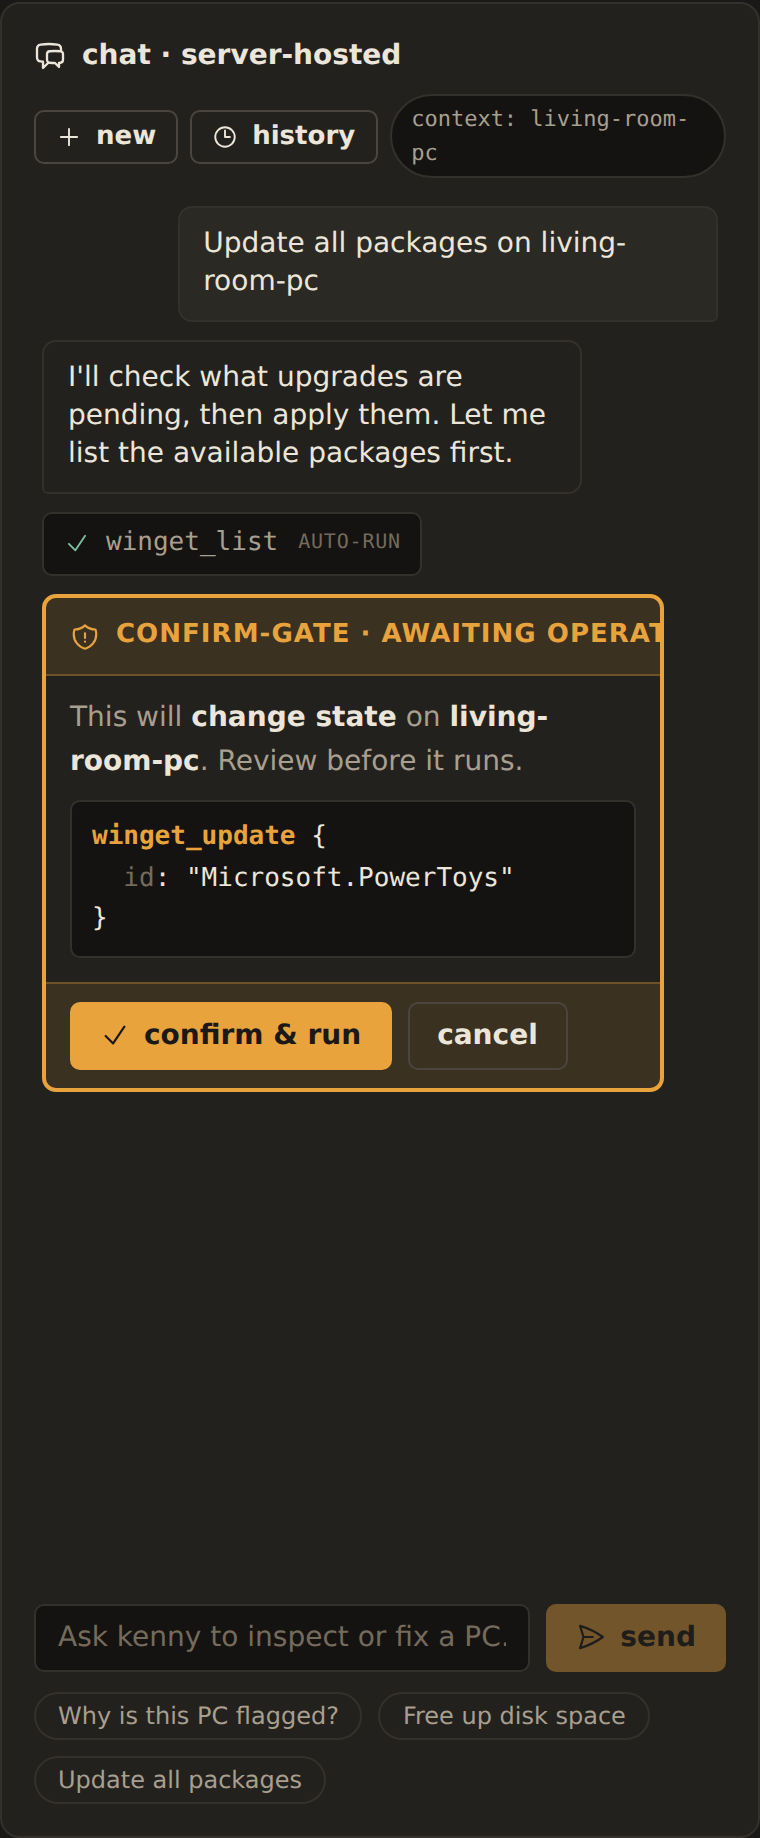
The server-hosted Claude chat, docked on the right. No local client needed — ask in plain language and Claude picks and runs kenny's tools.
- Context chip — shows whether the chat is scoped to the selected PC or the whole fleet; it mirrors your fleet selection automatically.
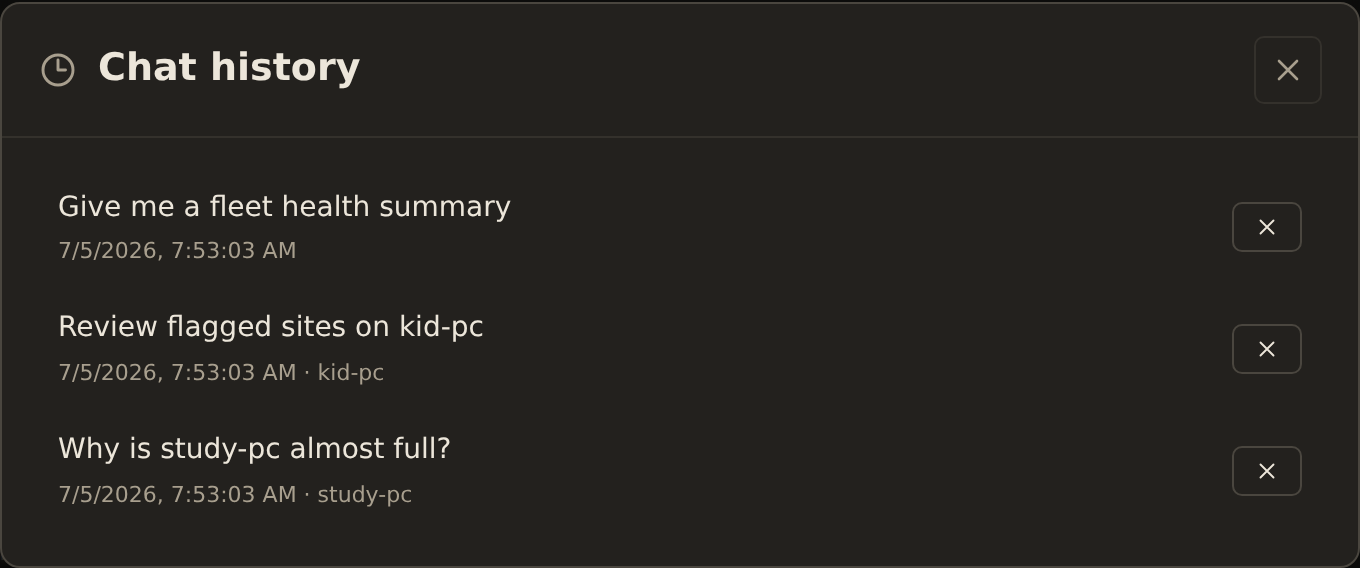
- new starts a fresh conversation; history browses saved ones (below).
- Transcript — user and assistant bubbles (assistant text is rendered markdown),
tool-run chips (with an
auto-runtag for read-only calls), inline screenshots, and the confirm-gate. - Confirm-gate — read-only tools run automatically; any state-changing tool pauses in an amber card showing the exact tool + arguments, with confirm & run / cancel. The composer is locked until you resolve it. See Tool reference.
- Composer — type and send; while a turn streams the button becomes stop. Suggestion chips ("Why is this PC flagged?", "Free up disk space", "Update all packages") pre-fill the box.
Chat history — every conversation is persisted; browse, resume, or delete past ones:
On desktop the rail is a docked column you can hide with the header ✨ button (persisted); below ~1180 px it becomes an overlay drawer that slides in over a backdrop (Escape or a backdrop click closes it).
The Activity tab
Fleet-wide observability, split into two sub-views (left nav): the tool-call audit log and events & logs.
Tool-call audit log
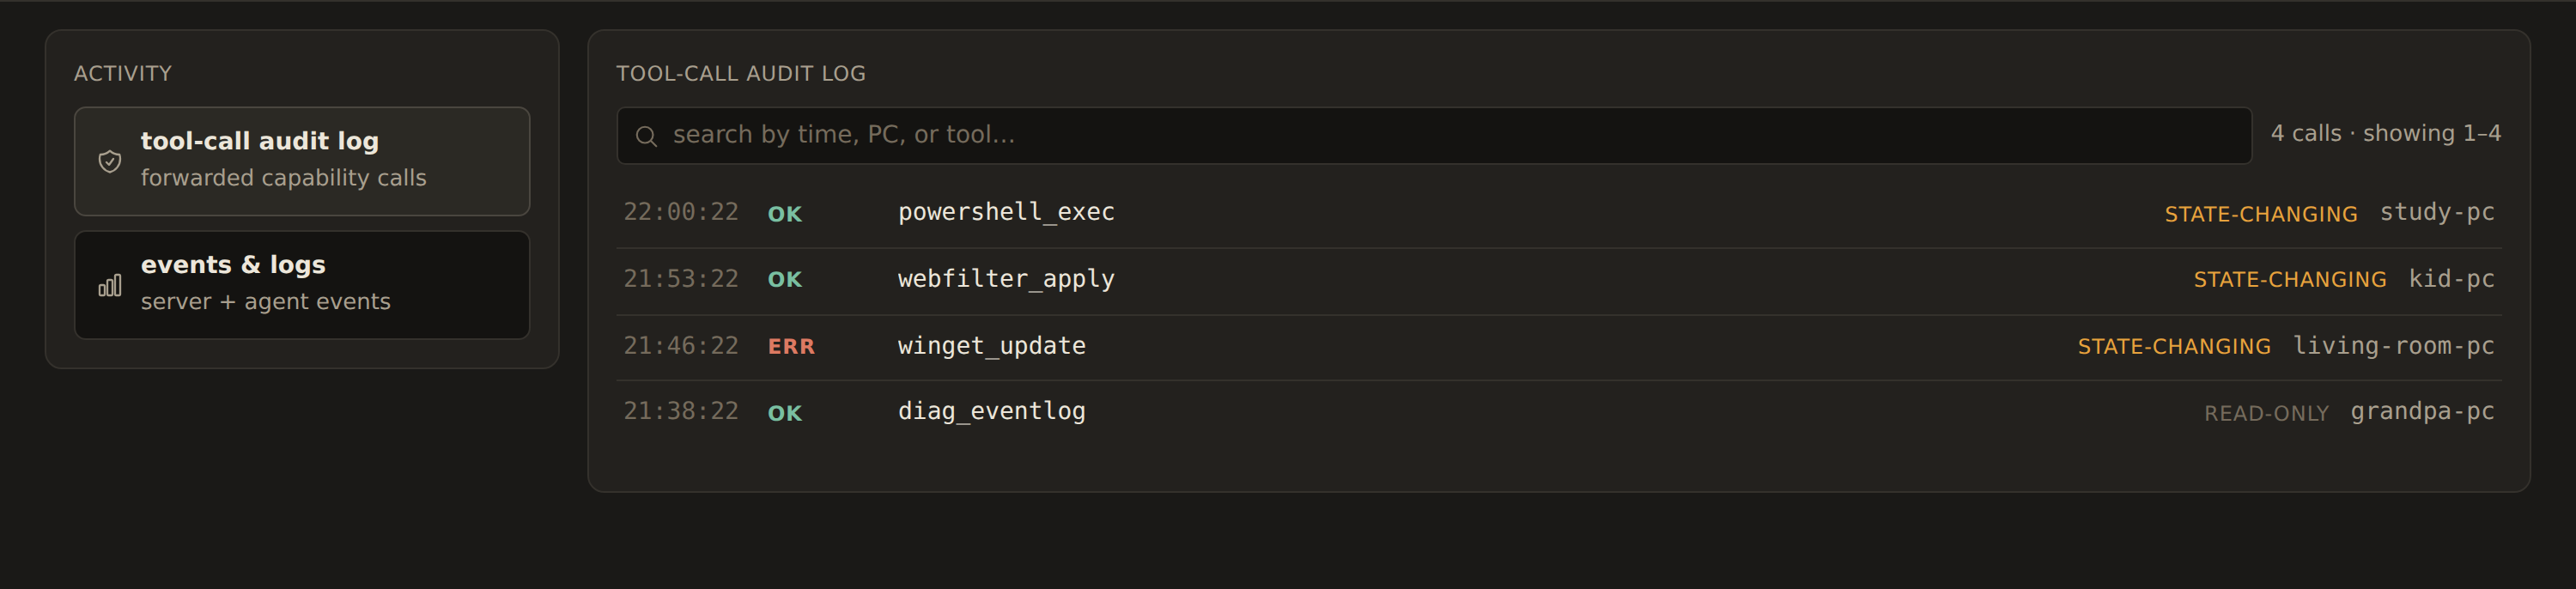
Every forwarded capability call, newest first: time, ok/err, tool, read-only vs state-changing, and the target PC. The search box (with autocomplete over tools, PCs, and times) filters live, and the list is paged.
Events & logs
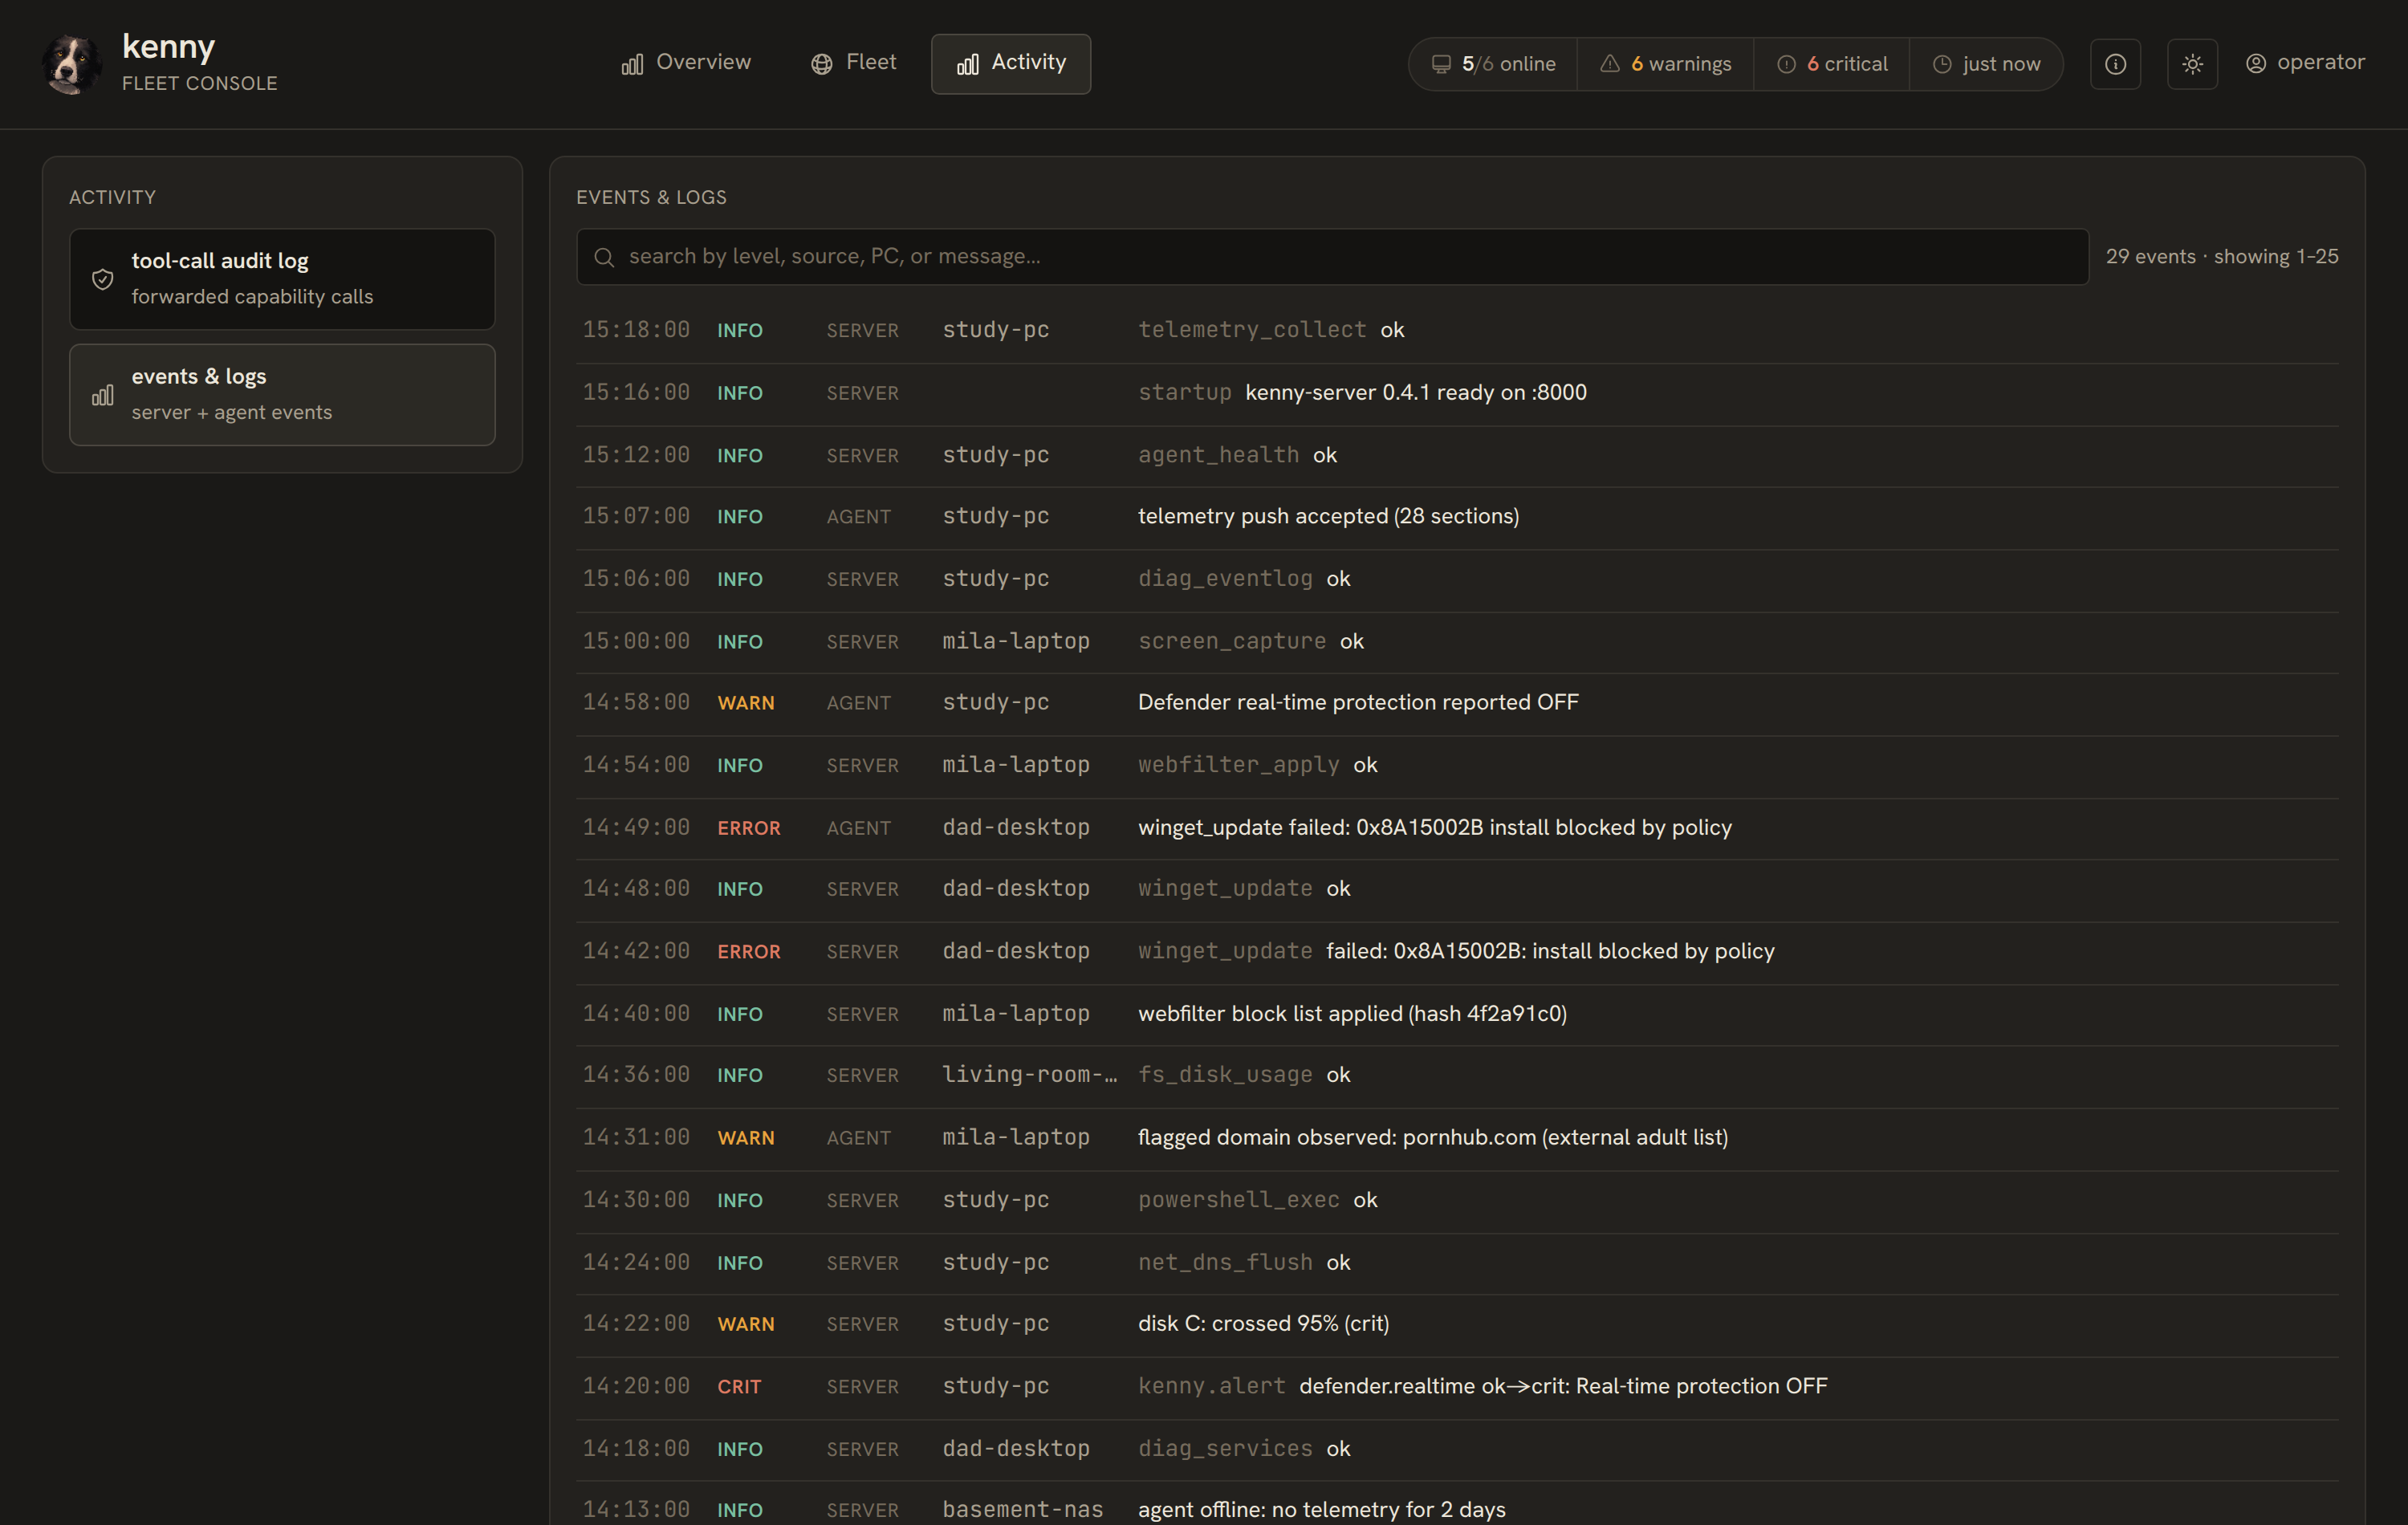
A unified stream of server + agent log lines, emitted alerts, and audit events: time, level (error/warn/info/debug), source, the PC (if any), and the message. Searchable by level, source, PC, or message, and paged. This is where alerts land as an audit trail.
The Flagged view
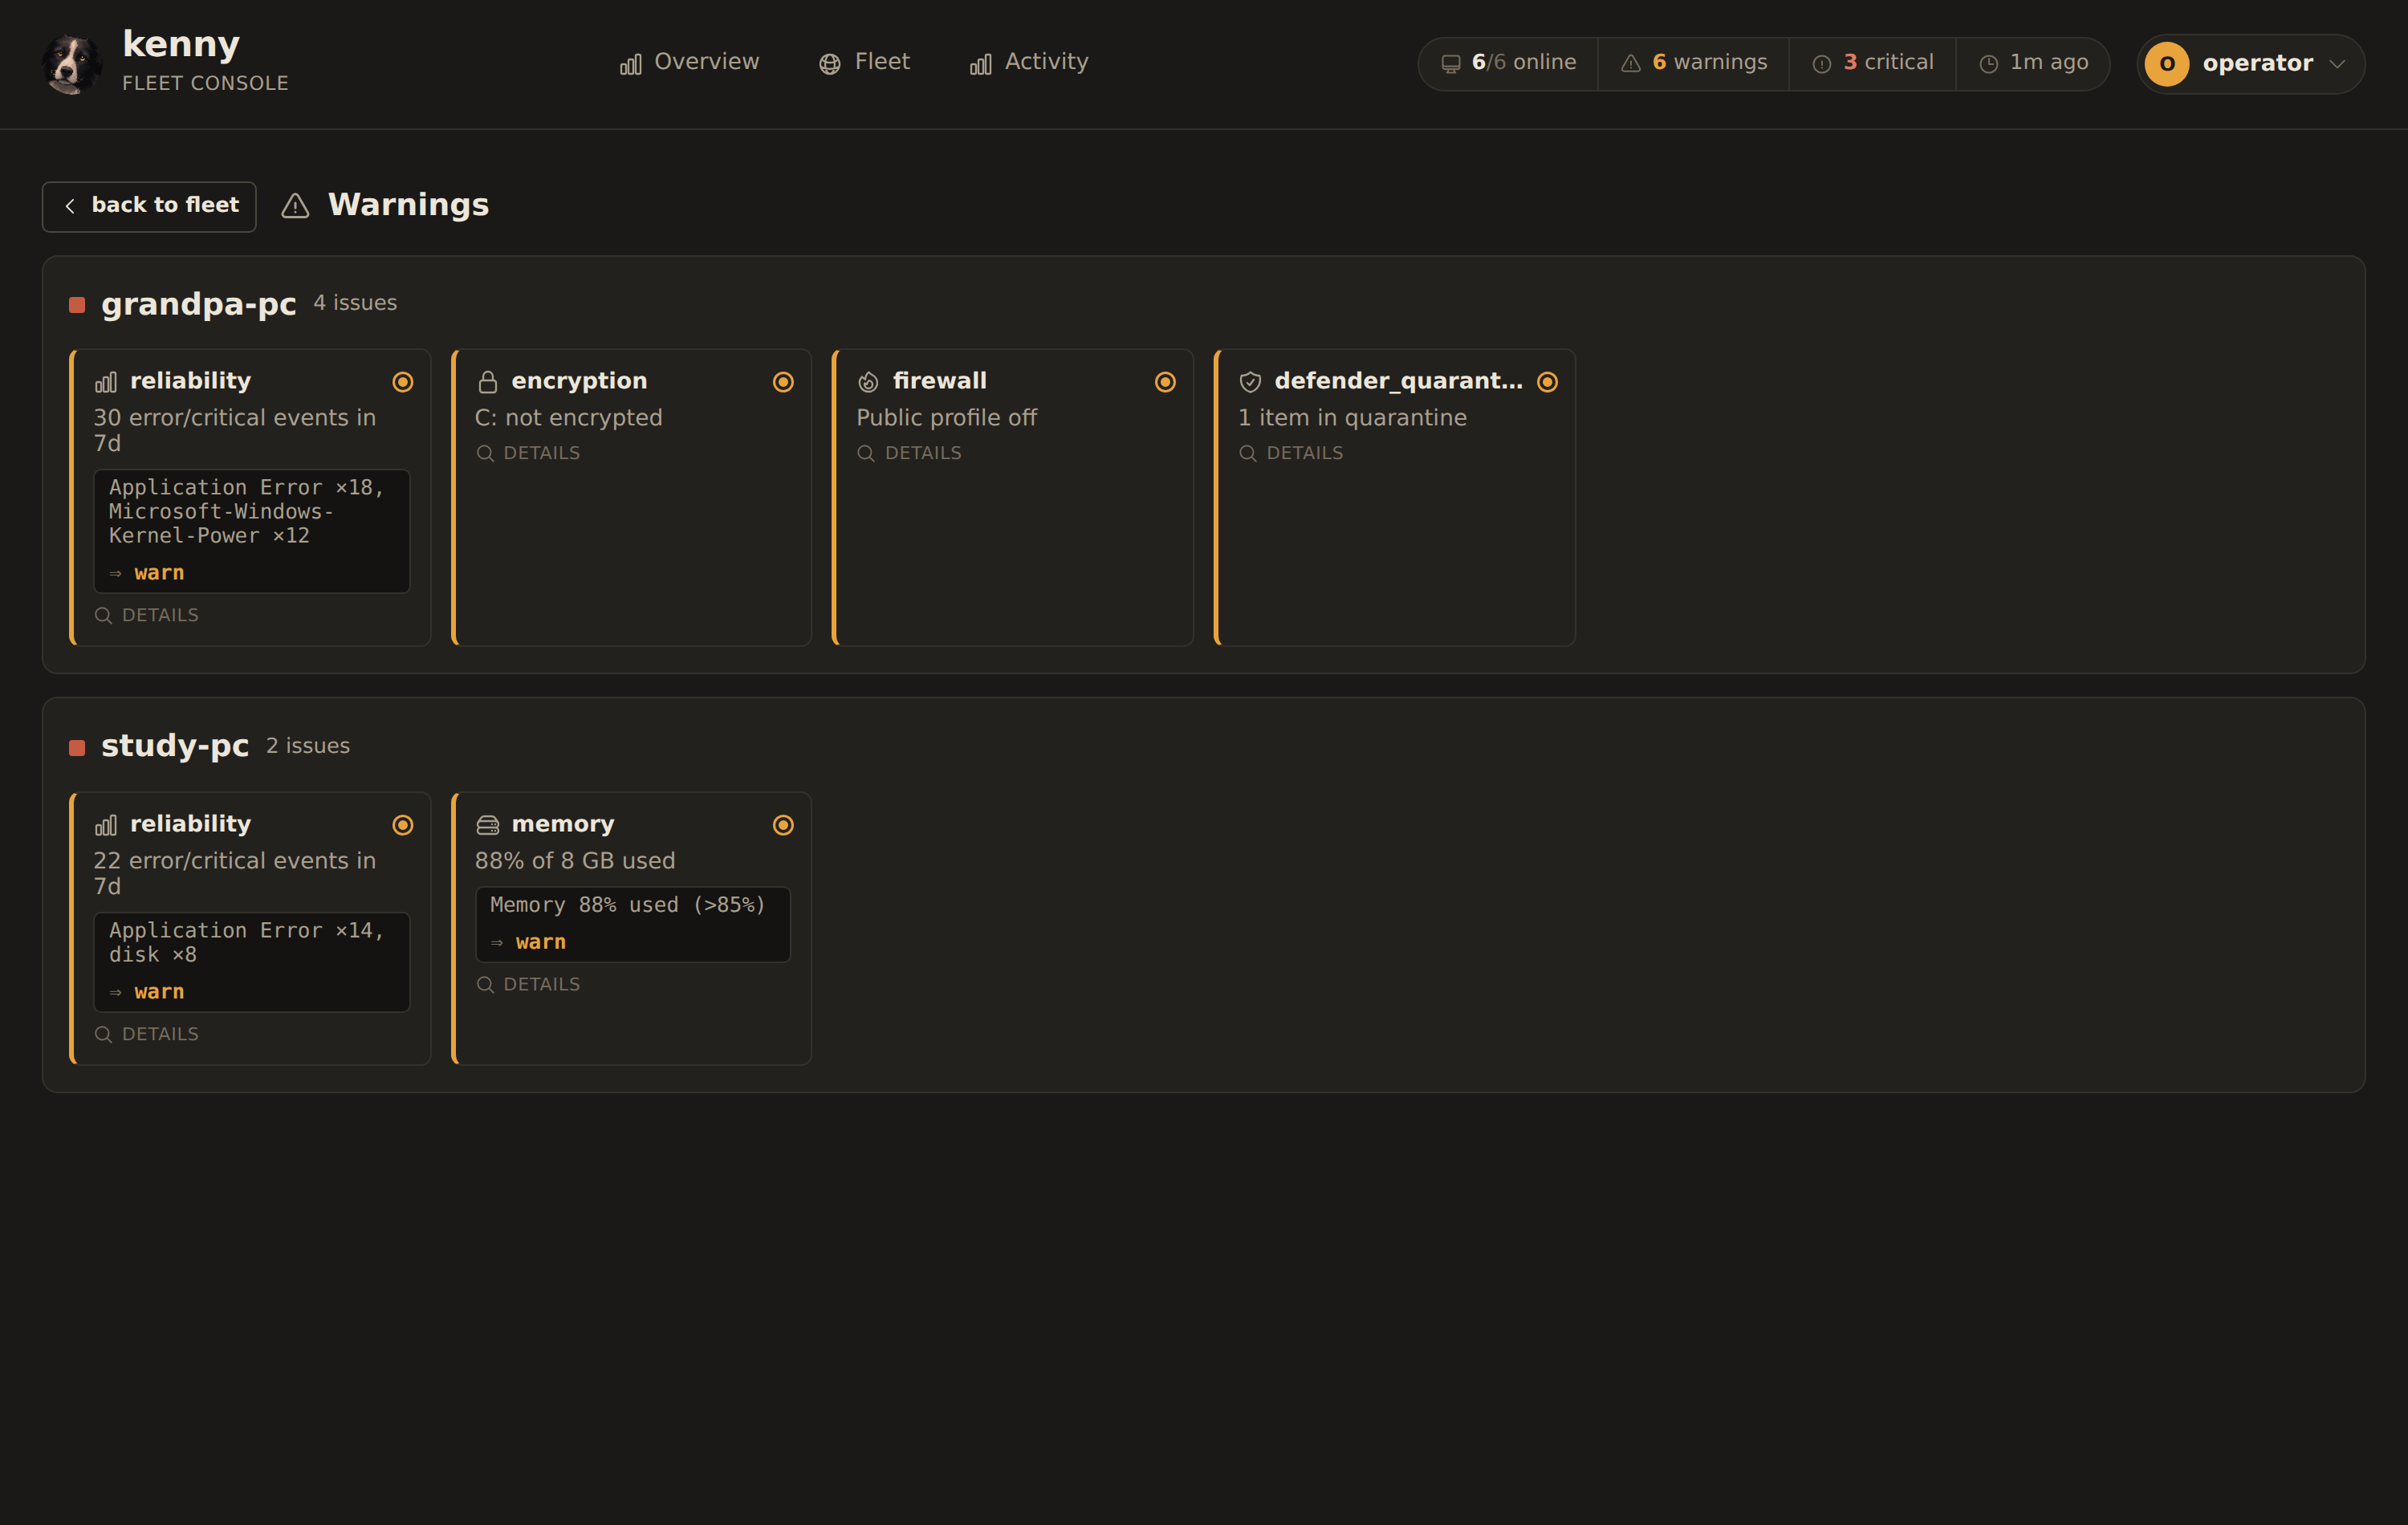
Reached by clicking the warnings or critical count in the header. It lists every flagged section of that severity, grouped by PC (busiest first). Each tile opens that section's detail in place — no navigation away — so you can triage the whole fleet without losing your spot. Back to fleet returns to the Fleet tab.
Adding & updating PCs
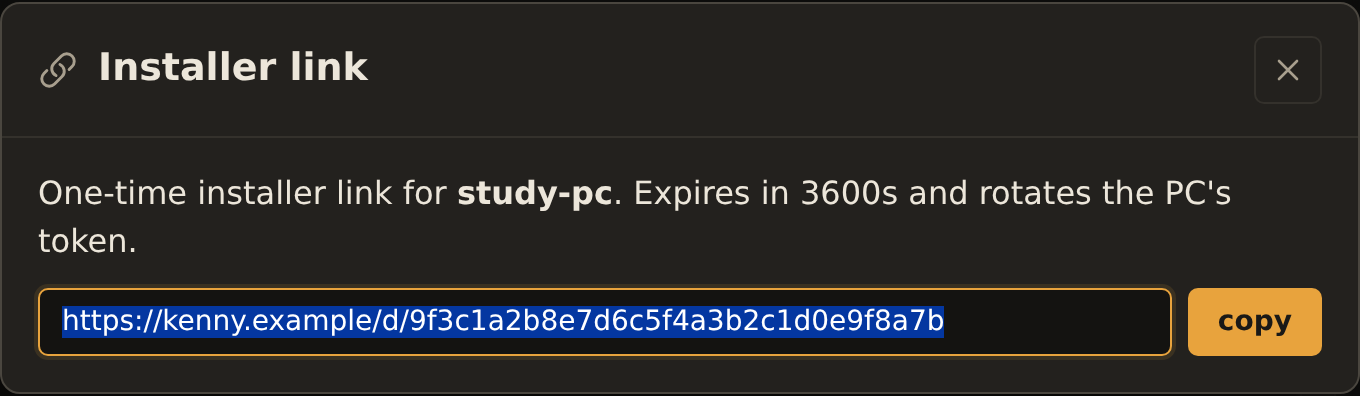
- Add a PC (Fleet list) onboards a new machine. Pick the target OS first.
On Windows, installer downloads a ZIP (the agent binary + a pre-filled
setup.bat+ a freshly minted token) and share link produces a one-time, expiring link the target user opens without your login. On Linux, both produce the one-line install command (curl -fsSL … | sudo sh) — a nonce-gated, single-use script carrying the same freshly minted one-time enrollment token (ADR-0038). - On an existing PC, reinstall / re-share re-provision that agent id (rotating its token, so the old install stops reporting) — a ZIP/link on Windows, the one-line command on Linux — and update pushes a server-triggered self-update. Update works on both Windows and Linux: the agent downloads the new binary, verifies its SHA-256, swaps it in place, and restarts its service (systemd on Linux, the Windows service on Windows).
- Remove (operator/superuser only, on the agent drill-down) takes a host out of
inventory: it purges that agent's snapshots, events, tokens, keys, web-filter state, and
scope assignments. A host still pinned via
KENNY_AGENT_TOKENSis refused (it would just re-appear on the next restart). The provisioning/reinstall actions above are gated to operator+ too; a scopedusersees only refresh and remote-help on its assigned hosts.
The full onboarding and update flows (with sequence diagrams) are in the User guide.
The About box
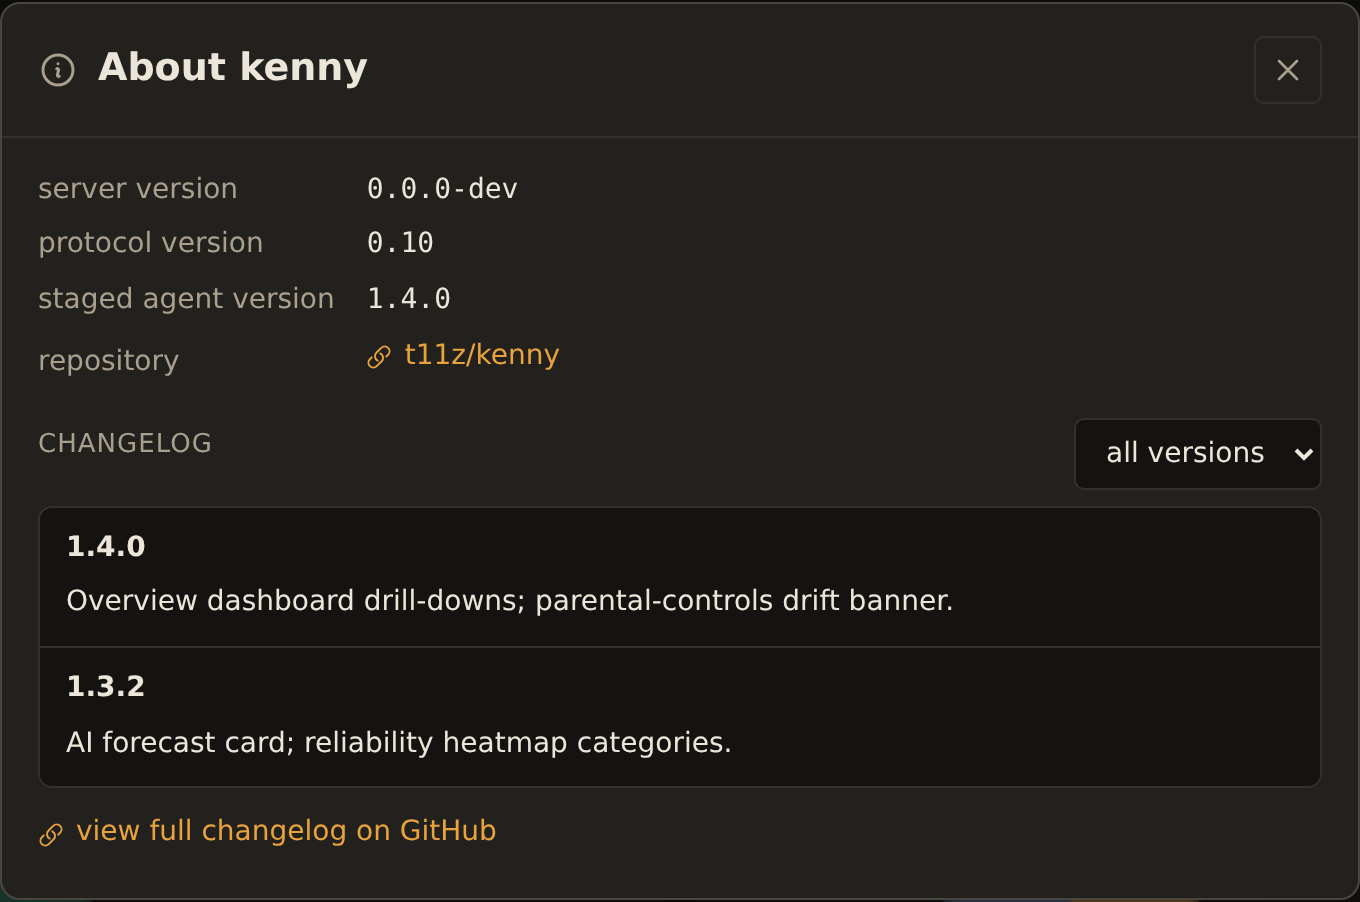
The About item in the user menu shows the server version, protocol version, staged agent version, and a link to the repository, plus a live changelog filtered from the project's GitHub Releases (filter by version, or view the full list on GitHub).
Themes, deep links & accessibility
- Dark & light — the warm "border-collie" dark theme is the default; the toggle lives in the user menu, is persisted, and is applied before first paint.
- Status is never colour-only — each status has a distinct shape + icon + label (OK = ● check, Warning = ◍ triangle, Critical = ■ octagon, Unknown = dashed ○), so the console is legible without colour.
- Deep links — every view is a URL hash you can bookmark or share (
#/overview,#/fleet,#/activity/audit,#/activity/events,#/flagged/warn,#/flagged/crit). - Keyboard & motion — Escape closes modals and the copilot drawer; animations respect
prefers-reduced-motion.
See also
- User guide — the common operator workflows.
- Telemetry reference — every section and its health rule.
- Tool reference — the capability and orchestration tools.
- Parental controls · Alerting & digests.